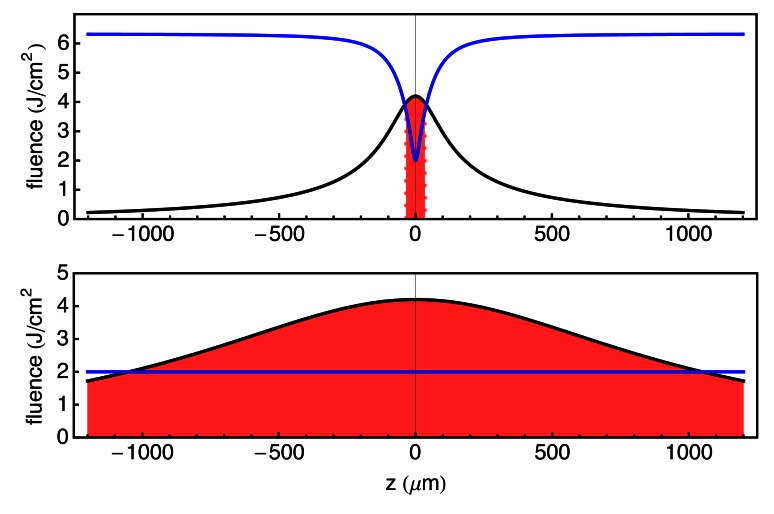
Fig. 11.
Upper plot – SSTF fluence (black curve), blue is ablation threshold assuming a square root dependence on the ablation threshold. Red filling is region where the pulse fluence is above damage threshold. Lower plot – Standard focus fluence (black curve), blue is ablation threshold for a constant pulsewidth. Red filling is region where the pulse fluence is above damage threshold.

