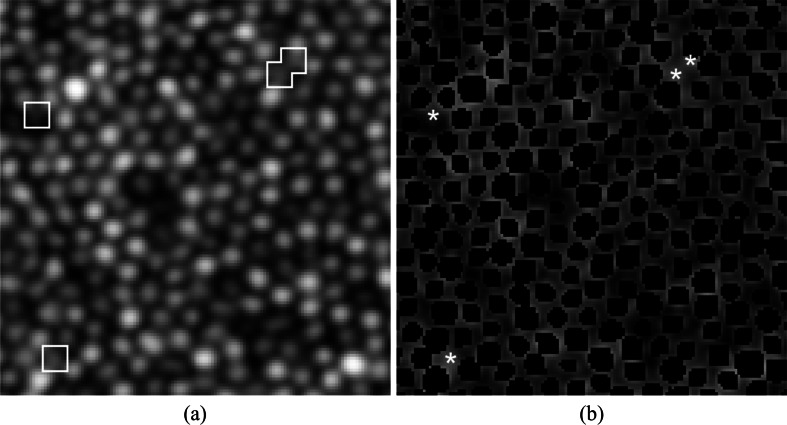
Fig. 2.
Identification of cones missed by local maxima. (a) AOSLO image in log scale with missed cones shown inside the white boxes. (b) Cone photoreceptors segmented using local maxima initialization in black, and pilot estimates of missed cones found using deconvolution and local maxima are shown in white asterisks.

