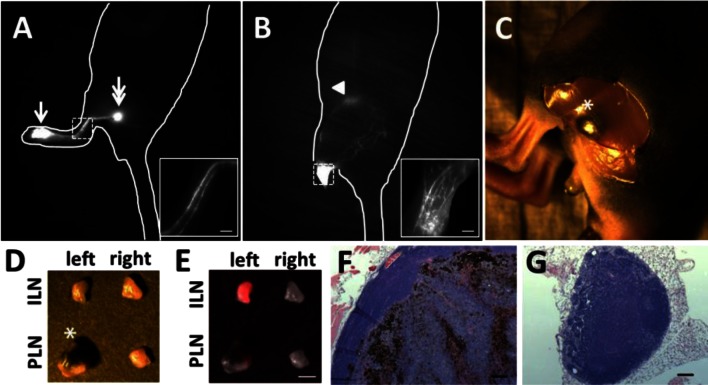
Fig. 4.
Fluorescent images of a mouse prior to (A) and 21 days p.i. (B) showing additional lymphatic drainage to the ILN, mainly due to tumor blockage of normal lymphatic drainage to the PLN. Arrow, ICG injection site. Double arrow, PLN. Arrowhead, ILN. The insets show magnified fluorescent images of the rectangles of Figs. 4A and 4B. In Fig. 4B, the injection site was covered to prevent image oversaturation. Scale, 1 mm. An intravital color image (C) after a skin incision above the PLN shows the melanoma-filled PLN. Asterisk, PLN. Color (D) and fluorescent (E) images of dissected PLNs and ILNs on the tumor and contralateral sides of a mouse. Note that the melanoma-filled PLN as indicated by an asterisk in Fig. 4D has low ICG fluorescence as compared to the left ILN due to rerouting of normal lymphatic drainage to the left ILN. Scale, 1 mm. H&E images (x10 objective) confirm extensive PLN metastasis (F) and no metastasis in contralateral PLN (G). Scale, 100 µm.

