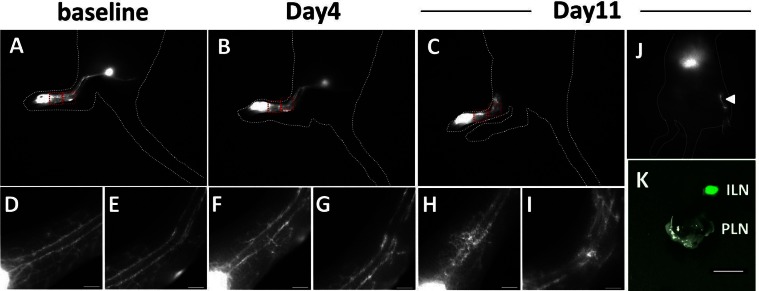
Fig. 7.
Representative fluorescent images of a mouse prior (A, D, E) to and at 4 (B, F, G) and 11 days p.i. (C, H, I). Scale, 1 mm. Magnified fluorescent images (D, E, F, G, H, I) of two rectangles in A, B, and C showed changes of lymphatic drainage during tumor growth in the PLN. Altered lymphatic drainage to the ILN was observed at 11 days P.I. as indicated by an arrowhead (J). The injection site was covered with black paper to prevent camera saturation. Fluorescent image of dissected ILN and PLN (K). Scale, 1 mm.

