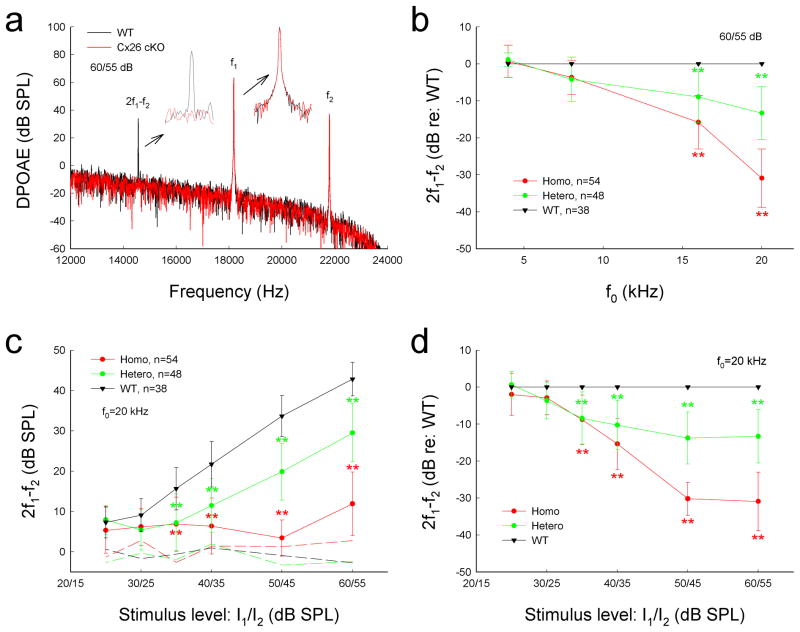
Fig. 3.
Reduction of acoustic emission in Cx26 cKO mice. a: Spectrum of acoustic emission recorded from Cx26 cKO mice and WT mice. Insets: Large scale plotting of 2f1–f2 and f1 peaks. The peak of DPOAE (2f1–f2) in Cx26 cKO mice was reduced but f1 and f2 peaks remained the same as those in WT mice. f0=20 kHz. b: Reduction of DPOAE in Cx26 cKO mice in frequency responses. DPOAEs were normalized to the WT mice. c: Reduction of DPOAE in Cx26 cKO mice in I/O plot. Dashed lines represent the noise levels of recording. d: Normalized reduction of DPOAE in homozygous and heterozygous Cx26 cKO mice. Data are expressed as mean ± S.D.; **: P < 0.001 as determined by one-way ANOVA with a Bonferroni correction.

