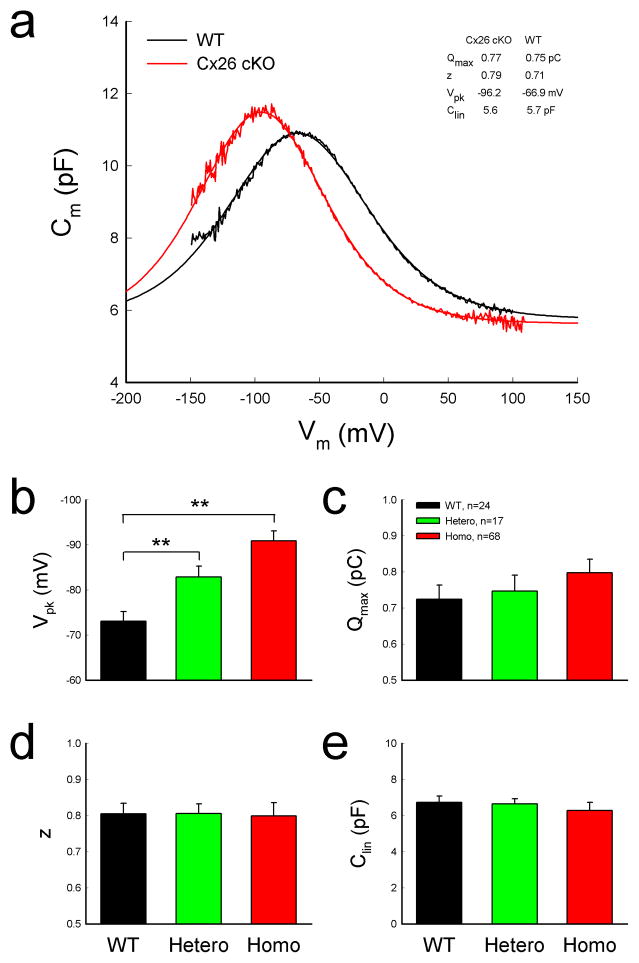
Fig. 6.
Left-shift of OHC NLC in Cx26 cKO mice. a: NLC recorded from Cx26 cKO and WT mice. Smooth lines represent fitting by the first derivative of Boltzmann equation. b–e: Parameters of NLC fitting. WT littermates served as a control group. Mice were P50–60 old. **: P < 0.001 as determined by one-way ANOVA with a Bonferroni correction. Data are expressed as mean ± S.D;

