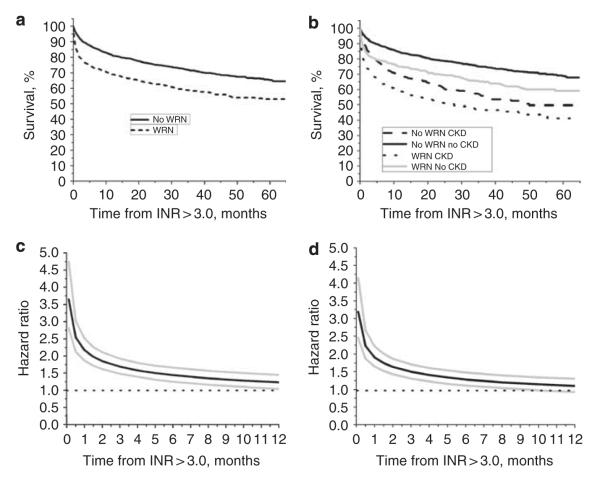
Figure 5. Survival analysis and hazard ratio in patients with and without warfarin-related nephropathy (WRN) and chronic kidney disease (CKD).
Panel a: Kaplan–Meier plot (log-rank P-value <0.0001) for WRN patients (N = 3179, black dotted line) and no-WRN patients (N = 810, black solid line). Panel b: Kaplan–Meier plot (log-rank P-value <0.0001) for patients with WRN and no WRN, stratified by CKD, no-CKD status. Patients with WRN and CKD (black dotted line) had the lowest survival rate. Patients with WRN but no CKD had better survival rates (gray solid line). Patients without WRN, but with CKD had better survival rates compared with WRN patients with CKD (black dashed line). Patients without both WRN and CKD had the best survival rate (black solid line). Panel c: the univariate Cox model with survival as a time-varying covariate was used to estimate the hazard ratio for death in the WRN versus no-WRN cohorts, with 95% confidence intervals (CIs) at selected early time points. Because violation of the assumption of proportional hazards, WRN and no-WRN status was included as a time-varying covariate in the model. As shown, the hazard ratio for death (WRN versus no WRN) was highest within the first week after international normalized ratio (INR) >3.0. Thereafter it decreased progressively until it reached non-significant levels 6 months later. Estimated hazard ratio (solid black line) with 95% CIs (gray lines) is shown. Panel d shows the hazard ratio described in panel c but adjusted for the covariates that were significantly different between the WRN and no-WRN cohorts: age at INR >3.0, CKD, diabetes mellitus, heart failure, atrial fibrillation, and glomerulonephritis. The adjusted hazard ratio is similar to that of the unadjusted hazard ratio. Also, there was no evidence of an interaction between WRN, no-WRN status, and CKD status (P = 0.2102). Estimated hazard ratio (solid black line) with 95% CIs (gray lines) is shown.

