
Figure 4. Site-specific phosphorylation of protein kinase A (PKA)-target sites of cardiac myosin–binding protein-C (cMyBP-C).
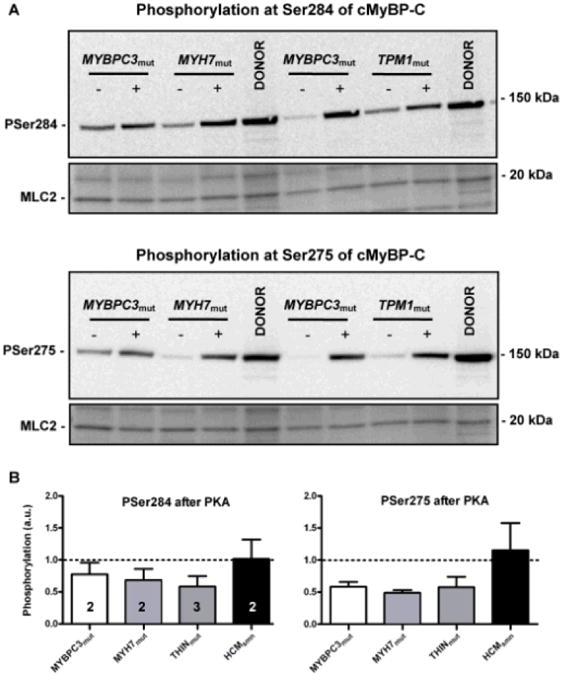
A, Western blot analysis of cMyBP-C phosphorylation with specific antibodies for PKA sites Ser284 (top) and Ser275 (bottom) before (−) and after (+) PKA treatment (phosphorylation values were corrected for minor differences in protein loading by Ponceau-stained MLC2, myosin light chain 2). B, Protein phosphorylation values were normalized to the values found in untreated donor samples, which were included on the blot and set to 1 (dotted line). Thin-filament mutations were clustered in a single group (THINmut). Numbers of samples included in the analyses are indicated in the bar graphs. All samples showed an increased phosphorylation at both sites on PKA treatment.