Figure 10.
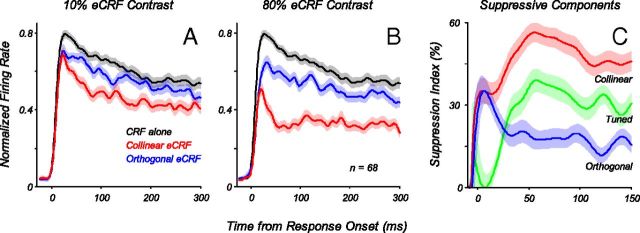
Temporal dynamics of eCRF suppression. The average response dynamics to a stimulus in the CRF, with the preferred stimulus parameters and a C90 contrast, when different stimuli are presented to the eCRF. All responses were first normalized to the peak response to the stimulus in the CRF alone (no eCRF modulation), and taken from the time of response onset to the stimulus in the CRF alone. A, Response dynamics to a stimulus in the CRF with no eCRF stimulus (black) as well as with collinear (red) and orthogonal (blue) stimuli in the eCRF presented at 10% contrast (lines, mean values; shaded regions, ±1 SEM). At the earliest times there was very little suppression from the eCRF stimuli, whereas later in time (30–40 ms) there developed a stronger suppression from the collinear eCRF stimulus. B, Similar plots to A, except here, stimuli in the eCRF were presented at 80% contrast. At earliest times (0–25 ms) there was some suppression from both eCRF stimuli, with stronger suppression coming from the collinear eCRF stimulus later (25–50 ms). C, To better highlight the dynamics, responses from B are replotted here as the percentage of response suppression. The suppressive components coming from the collinear and orthogonal eCRF stimuli are shown in red and blue, respectively. Plotted in green is the difference between those two curves, what we term the tuned suppressive component, which did not begin to develop until 25–50 ms.

