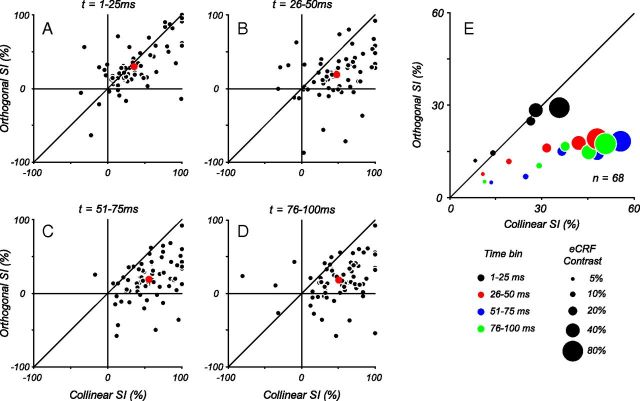
Figure 11.
Comparison of suppression to collinear and orthogonal stimuli over time. Suppression indices for 68 complex cells for collinear and orthogonal eCRF stimuli at 80% contrast were calculated as a function of time in 25 ms bins, where t is time from CRF response onset, and 100% represents complete suppression of the response and 0% represents no suppression; negative SI values indicate response facilitation. A, At the earliest times (1–25 ms) the amount of suppression was approximately equal between the two conditions, as shown by points lying along the unity line. The point in red indicates the mean suppression over all neurons. B, At later times (26–50 ms), stronger suppression from the collinear eCRF stimulus started to become evident, which persisted at later time points (C, D). E, The average suppression indices are plotted for the population of cells to illustrate how suppression developed across time and across contrasts. The size of the dot indicates the contrast presented in the eCRF, with larger sizes indicating higher contrasts. The color of the dot indicates the time bin over which the suppression indices were measured. At earliest times (black) the suppression between the two stimuli was equal, with higher contrasts inducing greater suppression. At later time points (red, blue, green), for all contrasts, suppression from the collinear stimuli in the eCRF was greater than from orthogonal stimuli.

