
Figure 3.
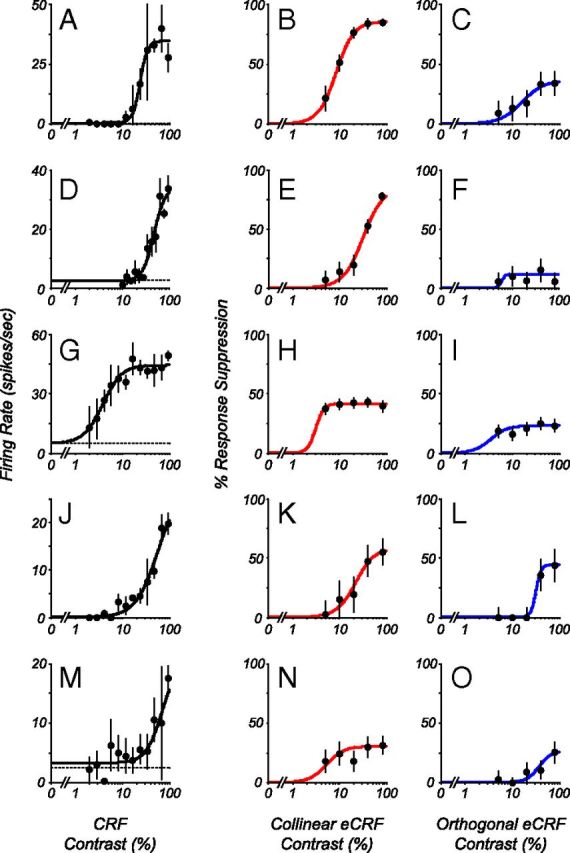
Comparison of responses and suppression as a function of contrast in five neurons that show a range of CRF contrast-response functions and suppression strengths from the eCRF. Each row represents a different neuron. The first column (A, D, G, J, M) shows contrast responses from the CRF for the example cells (mean ± 1 SD). Second (B, E, H, K, N) and third (C, F, I, L, O) columns show the percentage suppression as a function of contrast from collinear- and orthogonal-oriented stimuli in the eCRF, respectively (mean ± 1 SD). Lines are best fits of the Naka–Rushton function to the data. Collinear suppression was generally stronger than orthogonal suppression, and C50s from eCRF were generally equal to or lower than C50s from CRF.