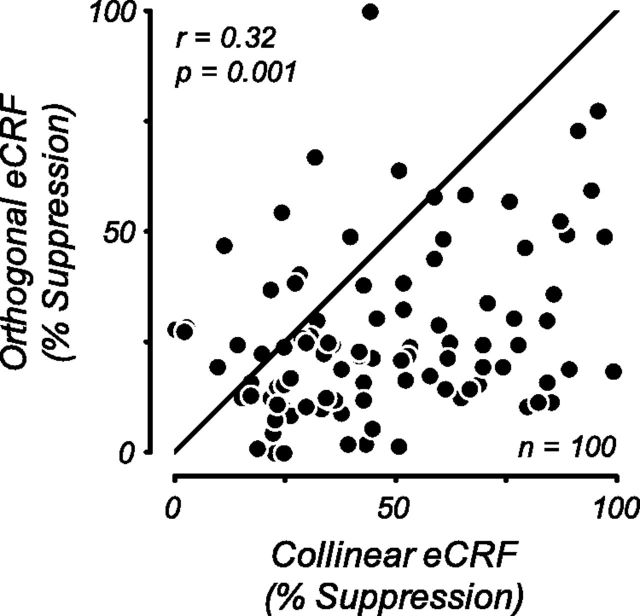
Figure 5.
Orientation-dependent eCRF suppression strength. Scatter plot of the maximum strength of suppression from collinear and orthogonal stimuli in the eCRF. Suppression strength was defined as the percentage suppression of CRF responses and was estimated as the Rmax parameter from contrast response function fits to eCRF suppression. There was a significant correlation between the strength of eCRF suppression for collinear and orthogonal stimuli (r = 0.32, p = 0.001). Nearly all points lie below the unity line, indicating that there was consistently stronger suppression from the collinear eCRF stimulus.

