
Figure 6.
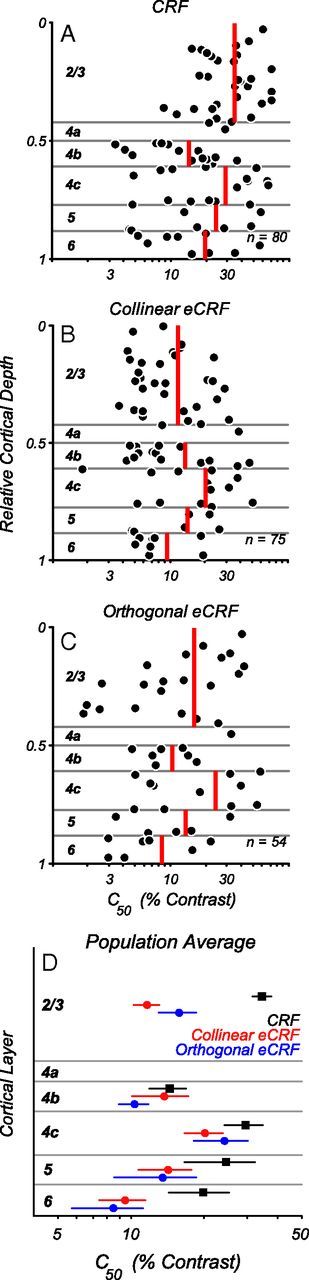
Contrast evoking half-maximal response (C50) of CRF and eCRF across cortical layers. Measures of C50 are plotted for excitation from the CRF and suppression from the eCRF in relation to the cortical depth of recordings. Red vertical lines indicate mean values within each layer. A, Laminar distribution of the C50 parameter obtained from the best-fitting Naka–Rushton function to the CRF contrast responses for each neuron. On average, the contrast eliciting half-maximal excitation from the CRF was ∼20% for all layers and there was a trend for the lowest C50s to occur in layers 4b and 6. B, Distribution of C50 parameter values obtained for each neuron for eCRF suppression from collinear stimuli. Contrast sensitivity for suppression was high (C50 ∼ 10% contrast) across all layers, even in layers 2 and 3 for which the CRF had a low-contrast sensitivity (A). C, The distribution of C50 for suppression from orthogonal gratings in the eCRF. Even though orthogonal grating in the eCRF produced relatively weak suppression, the sensitivities were higher on average than those for CRF excitation. D, Summary plot of the average values for CRF (black squares) and eCRF C50 (collinear, red circles; orthogonal, blue circles) across cortical layers (mean ±1 SD). eCRF C50 values were lower than CRF values across all layers, with the largest differential in layers 2/3.