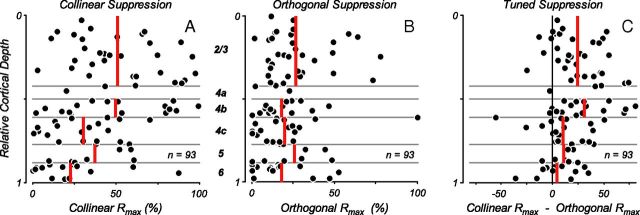
Figure 7.
Suppression indices across cortical layers. Measures of maximum suppression strength (Rmax parameter of fit to response suppression as a function of contrast) are plotted as a function of cortical layer for conditions in which stimuli of either collinear or orthogonal orientation were presented within the eCRF, while the contrast in the CRF was the C90 value for each neuron. Rmax values of 0% indicate no modulation from eCRF stimulation and values near 100% indicate complete suppression of the neural response. Red vertical lines indicate mean values within each layer. A, The distribution of suppression strengths is shown for collinear stimuli in the eCRF. B, Distribution of suppression strengths for an orthogonal orientation in the eCRF. The suppression strength across layers with orthogonal stimuli was reduced compared with collinear orientation in the eCRF, yet there were still some neurons that showed strong suppression. C, The suppression strength of the orientation-tuned component, i.e., the differences in suppression between A and B, was greatest in layers 2/3 and 4b (24 ± 4% and 31 ± 7%, respectively) and much weaker in layers 5 (11 ± 4%) and 6 (5 ± 5%, mean ± SEM).

