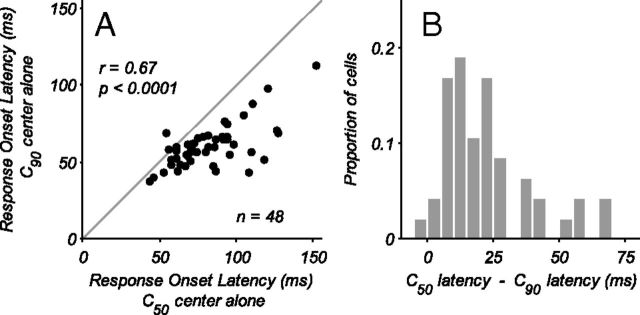
Figure 8.
Change in CRF response onset latency with contrast. A, Response onset latencies for stimuli driving the CRF alone are shown for C50 and C90 contrasts. The latency was determined to be the first time point where the stimulus-driven cumulative spike count was significantly greater than that of the spontaneous activity (see Materials and Methods). With lower contrast (C50) the response onset latencies increase, as shown by the points lying below the unity line. B, Histogram of the difference in onset latency between the C50 and C90 conditions. The average increase in latency due to lowering of stimulus contrast from C90 to C50 was 20 ms.

