Fig. 2.

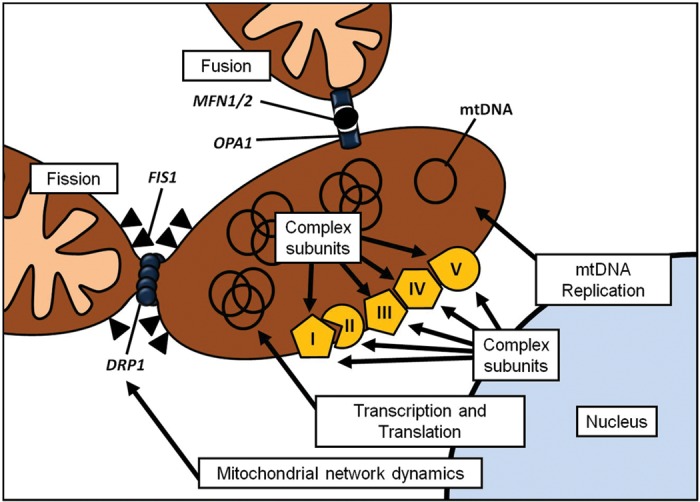
Interaction between nDNA and mtDNA. Cartoon demonstrating the complex interaction between genes encoded by nDNA and the processes they control in the mitochondrion.

Interaction between nDNA and mtDNA. Cartoon demonstrating the complex interaction between genes encoded by nDNA and the processes they control in the mitochondrion.