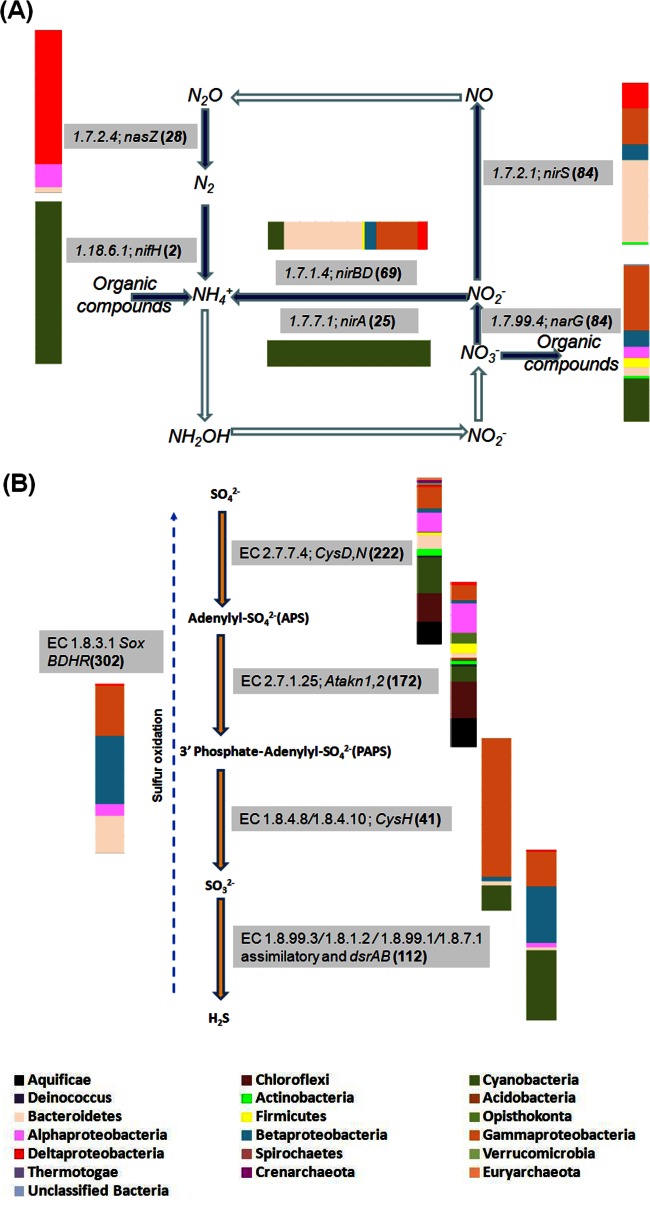
Fig 1.
Phylogenetic profiles for key enzymes in nitrogen cycling (A) and sulfur reduction and oxidation (B). Color-coded bars indicate the percentages of abundance of different genera for each category of enzymes. Each gene or enzyme designation is preceded by the enzyme nomenclature designation and followed by the number of reads annotated from the metagenome (in parentheses). The filled and open arrows indicate the presence and absence of enzymes, respectively. The dashed line shown in Sox pathways indicates that the steps are more complicated than shown.

