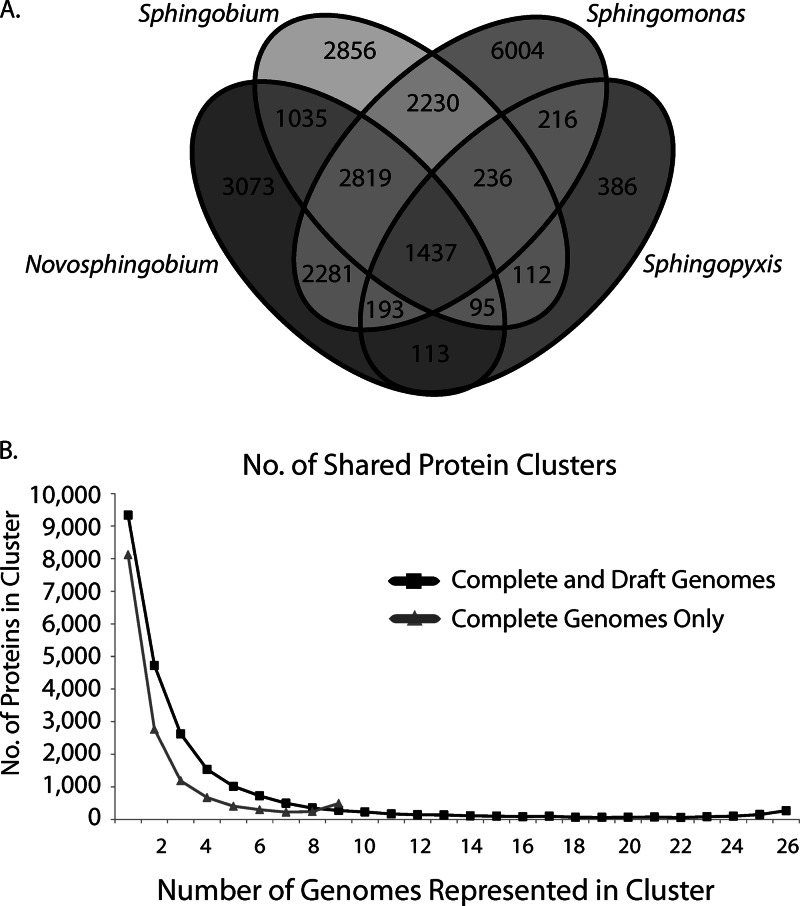
Fig 2.
(A) Venn diagram showing the number of shared and unique protein clusters identified in the 4 sphingomonad genera. (B) Distribution of protein clusters identified in the complete and draft sphingomonad genomes. The x axis represents the number of genomes encoding a member of a protein cluster, and the y axis represents the total number of clusters having that many genomes represented.

