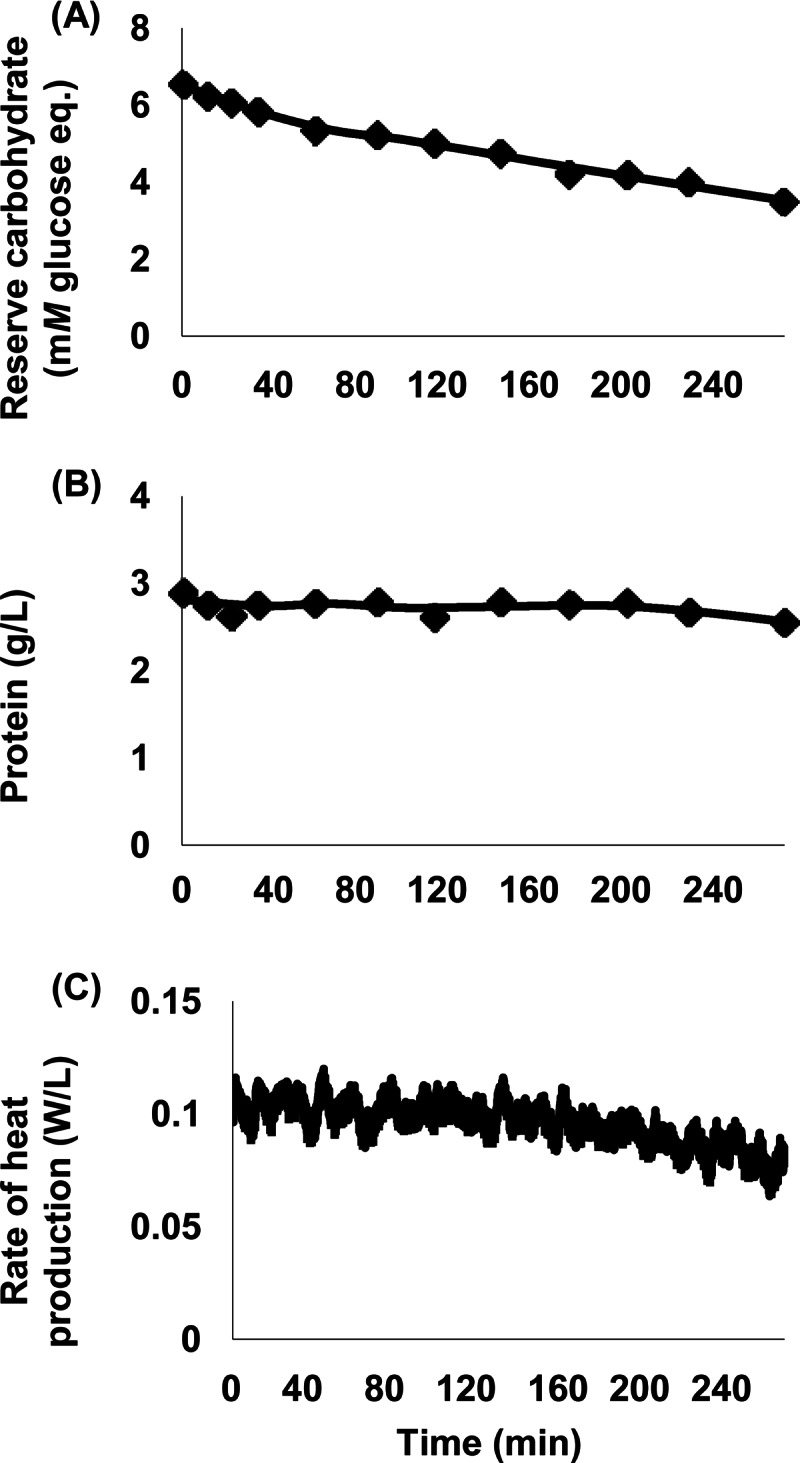
Fig 2.

Response of mixed rumen microbes to starvation. (A) Reserve carbohydrate. (B) Cell protein. (C) Rate of heat production. Data are from cow 472 and represent one experiment; data for 3 other cows (representing 3 additional experiments) were similar (data not shown). Reserve carbohydrate was expressed in mM monomeric glucose equivalents. Each data point represents one sample that was analyzed in triplicate. Heat production was measured at 1-s intervals as described in the text.
