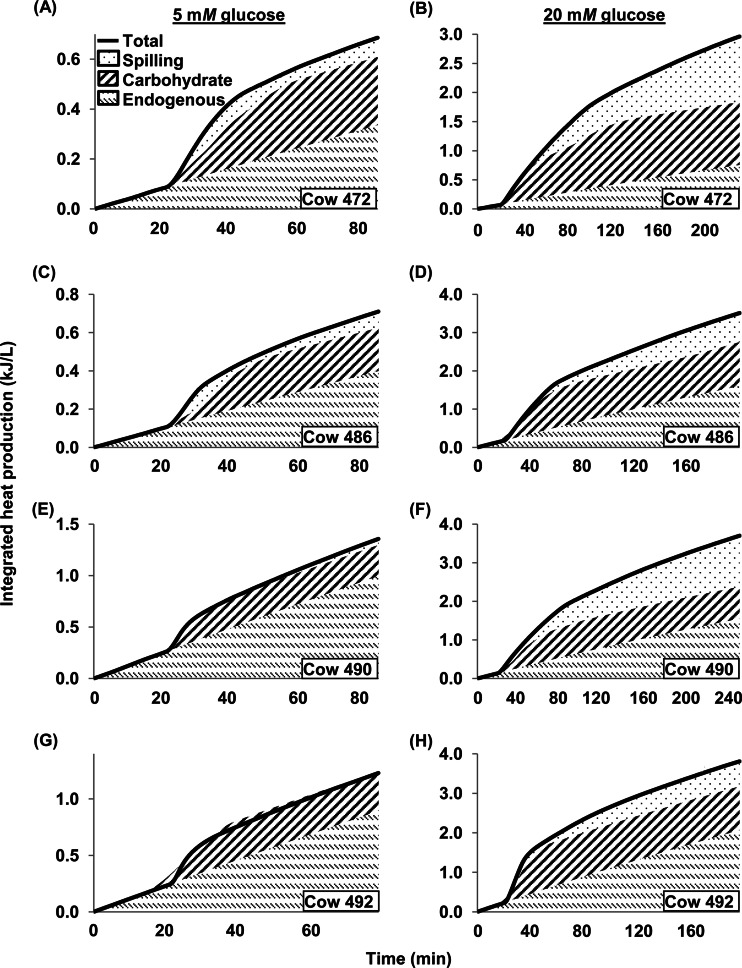
Fig 3.
Integrated heat production of mixed rumen microbes in response to 5 mM (A, C, E, G) or 20 mM (B, D, F, H) glucose. Shown are values of heat production accounted for by endogenous metabolism, synthesis of reserve carbohydrate, and energy spilling for cows 472, 486, 490, and 492. Each panel represents 1 experiment. Methods of calculation are described in the text and Fig. S3 in the supplemental material.

