Fig 1.

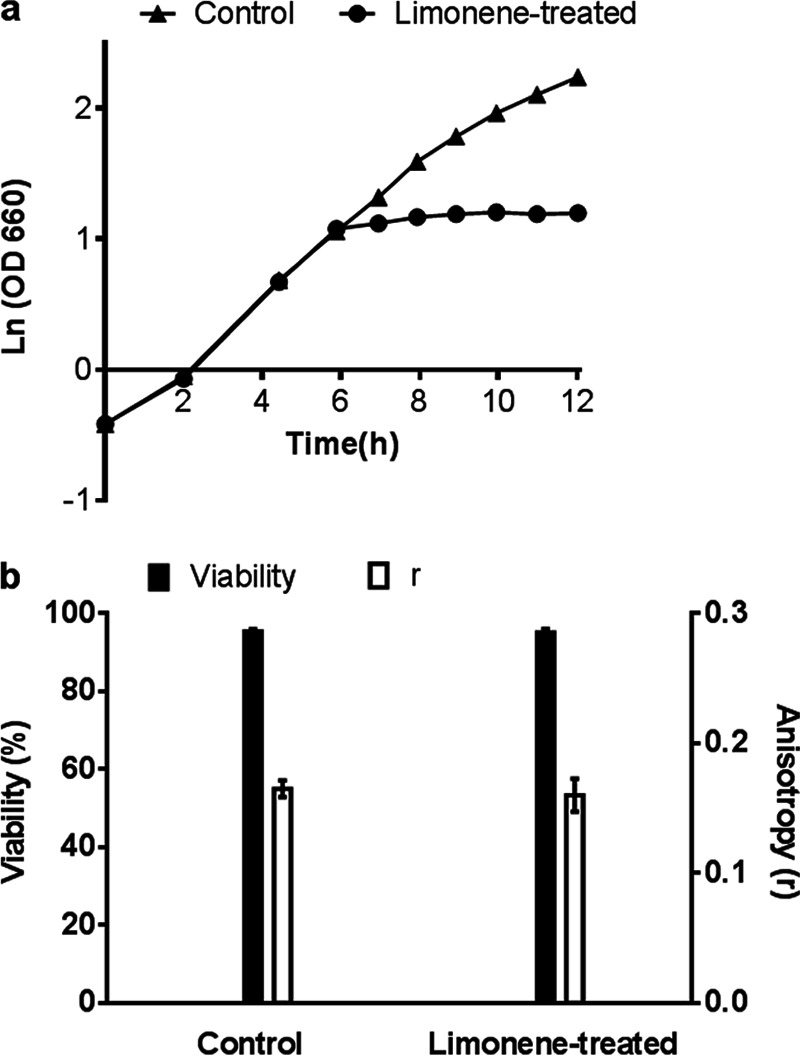
(a) Growth plot for control and limonene-treated (107 mg/liter) cultures. (b) Cell viability and membrane fluidity (anisotropy, r) measurements at 2 h after limonene addition. Error bars represent one standard deviation (SD) above and below the mean for biological replicates.
