
Fig 2.
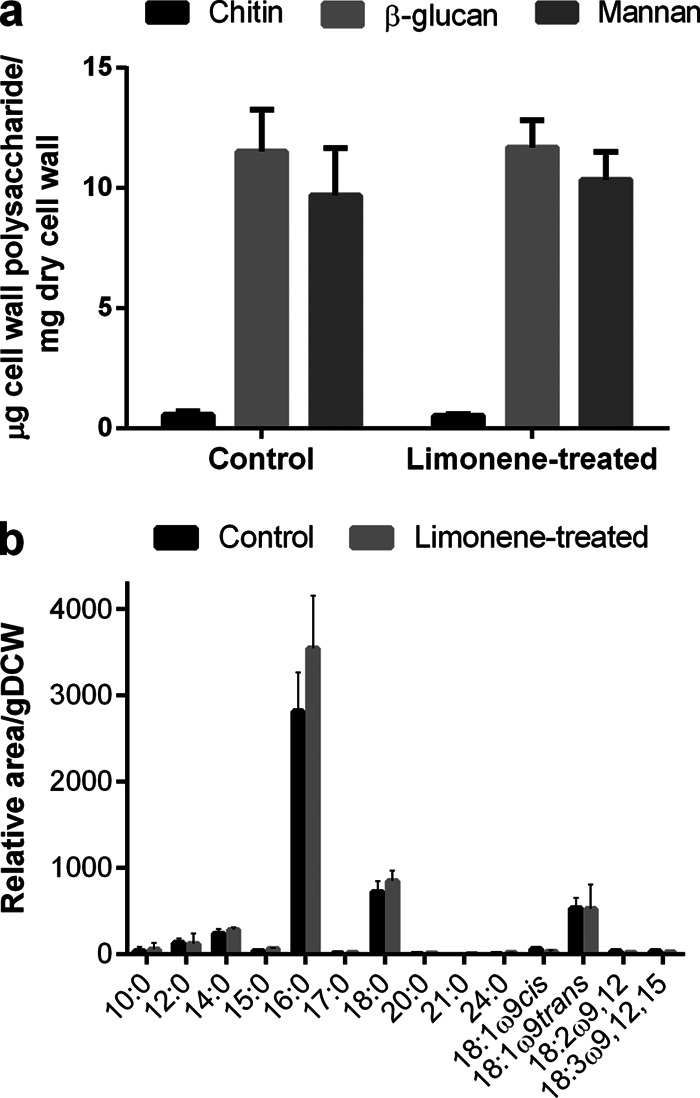
Cell envelope compositional changes due to limonene shock. (a) Cell wall polysaccharide compositions for control and limonene-treated cells. (b) Fatty acid composition at 2 h after limonene challenge. 10:0, decanoic acid; 12:0, dodecanoic acid; 14:0, myristic acid; 15:0, pentadecanoic acid; 16:0, palmitic acid; 17:0, heptadecanoic acid; 18:0, octadecanoic acid; 20:0, eicosanoic acid; 21:0, docosanoic acid; 24:0, tetracosanoic acid; 18:1ω9cis, oleic acid; 18:1ω9trans, elaidic acid; 18:2ω9,12, linoleic acid; 18:3ω9,12,15 linolenic acid. Error bars represent one SD above the mean (n = 3).