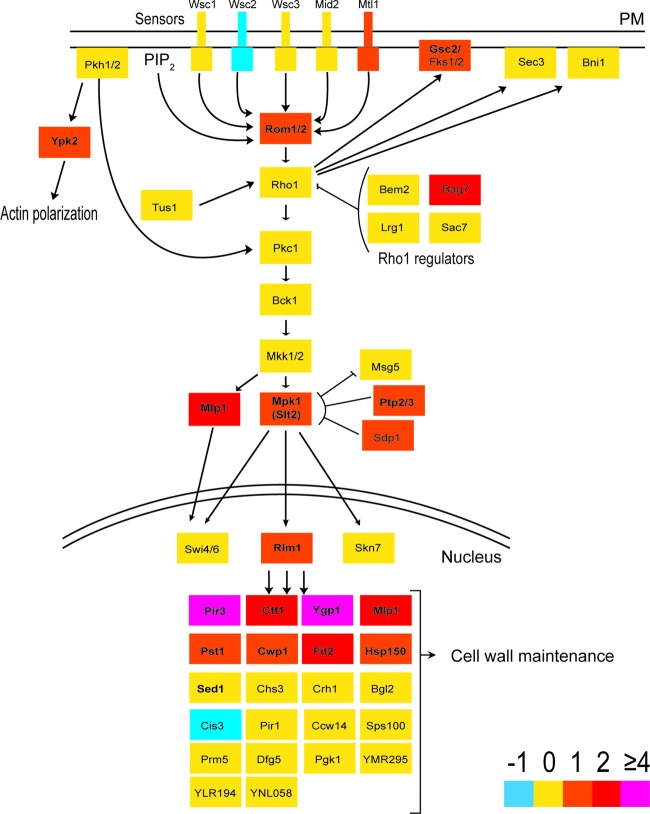
Fig 6.
Cell wall integrity (CWI) signaling pathway with transcriptomic expression changes during limonene stress. Colors indicate the fold change (log2) cutoffs. Genes in bold represent genes that were differentially expressed (Bonferroni-corrected P value of <0.01). PM, plasma membrane; PIP2, phosphatidylinositol-4,5-bisphosphate. (Adapted from reference 70 with permission.)

