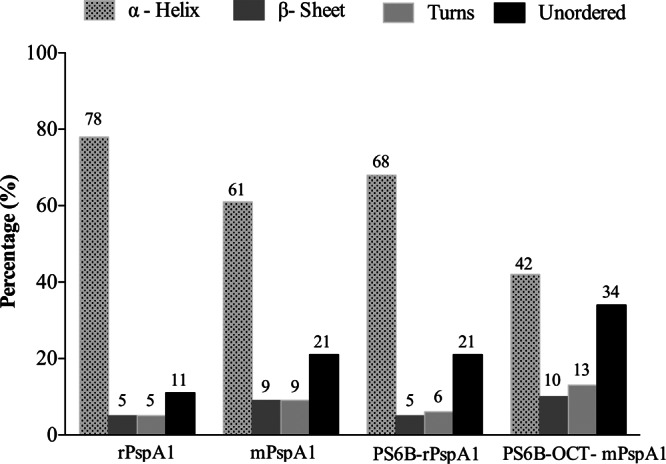
Fig 3.

rPspA1 secondary structure following conjugation. The protein secondary structure was assessed by CD. rPspA1 was compared to rPspA1 after modification with formaldehyde (mPspA1) and to rPspA1 after conjugation to PS6B by reductive amination (PS6B-rPspA1) or by conjugation using DMT-MM (PS6B-OCT-mPspA1). CD spectra were obtained on a Jasco J-810 spectropolarimeter at 20°C. The measurements were performed at wavelengths from 185 to 260 nm and intervals of 0.1 nm in a 0.1-cm-path cell. The secondary structure deconvolution analysis was performed with Dichroweb software, using the CDSSTR algorithm.
