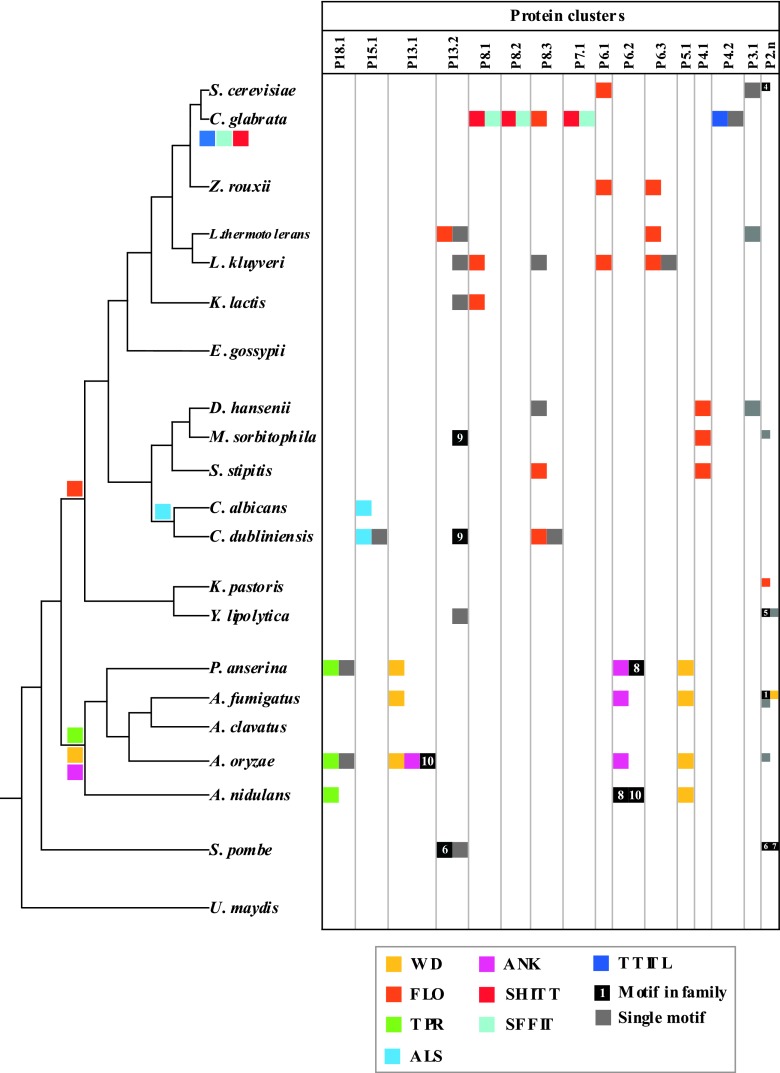
Fig 1.
Distribution of megasatellites in the 21 genomes studied. Left, tree topology (68, 69). Branch lengths are arbitrary. Motif families are represented by a color code. Motifs drawn on the tree indicate their proposed time of appearance during evolution, under a parsimony hypothesis. Right, protein clusters containing two or more proteins are represented by vertical columns. Nonunique motifs are indicated by their number in a black box (see Table S1 in the supplemental material). Unique motifs are shown in gray. P2.n, all clusters containing only two proteins.

