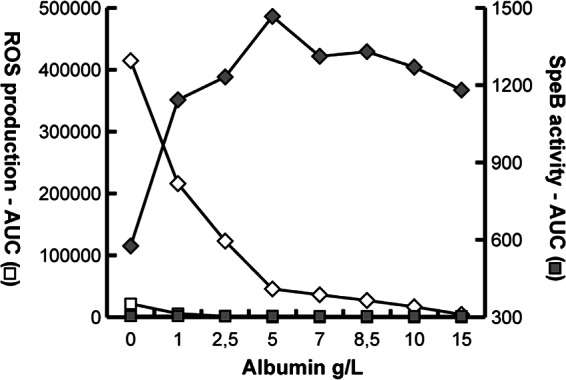
Fig 3.

ROS production and SpeB activity in the presence of increasing concentrations of HSA. Detectable extracellular ROS (♢) are trapped by HSA, allowing SpeB activity (◆) to increase under the same conditions. Negative controls are PMNs alone (□) and PMNs and SpeB (■).
