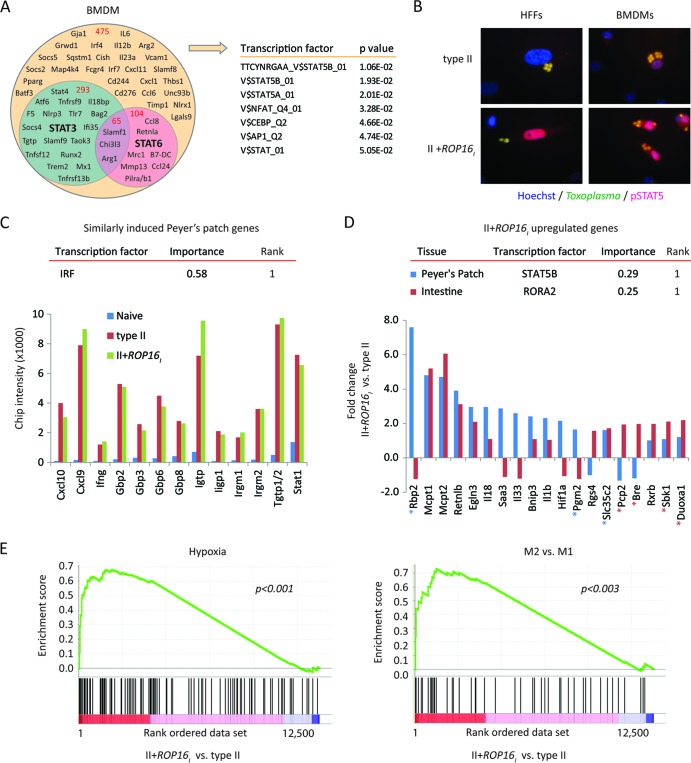
Fig 4.
Evidence for STAT5 activation by Toxoplasma ROP16. (A) A Venn diagram depicting ROP16-regulated host genes (1.7-fold) that are influenced by STAT3 and/or STAT6 in infected BMDMs. BMDMs from Stat6−/−, Stat3fl/fl LysM-cre, or Stat3fl/fl control mice were infected with the type II engineered Toxoplasma strains to determine ROP16-regulated genes whose expression was regulated by STAT3 and/or STAT6 (see Materials and Methods). Gene symbols and the total numbers of genes (in red) that fall within each category are indicated within the diagram. TFBS analysis of ROP16-regulated genes that were not influenced by STAT3/6 was performed by GSEA, and the most significant TFBSs are listed. (B) At 20 h after infection with the indicated parasite strains, cells were analyzed by immunofluorescence for phosphorylated STAT5. Representative immunofluorescence images of infected HFFs and BMDMs are shown. (C) On day 5 following oral challenge with the indicated parasite strains, individual Peyer's patches from C57BL/6 mice were dissected and analyzed by bioluminescence imagining. Peyer's patches with similar parasite burdens (see Fig. S6 in the supplemental material) and a Peyer's patch from a naive mouse were analyzed by microarray analysis. The normalized microarray chip intensities for the indicated genes are plotted; all genes are within the top 50 genes induced following infection compared to their expression in the naive control. TFBS enrichment analysis (DiRE) was performed on all Peyer's patch genes that were upregulated, on average, 1.7-fold following infection compared to the level of regulation in the uninfected sample [0.8 < log2(average gene expression of type II and II+ROP16I strain infections)/gene expression in the naive sample]. The top-scoring TFBS (rank = 1) and its importance value are given. (D) As in panel C, but the fold change in gene expression between II+ROP16I strain- versus type II strain-infected Peyer's patches and small intestines with Peyer's patches removed (approximately the jejunum) is plotted. The top-scoring TFBS and its importance value (DiRE) are indicated for II+ROP16I strain-upregulated Peyer's patch and intestinal genes. Genes bearing putative STAT5 or RORA2 TFBSs in their promoters are indicated with blue and red asterisks, respectively. (E) Profile of the running enrichment score and positions of members of gene sets for M2 versus M1 activation and hypoxia (determined by GSEA) on a rank-ordered list of II+ROP16I strain- versus type II strain-infected Peyer's patches. The nominal P value is indicated. The GSEA diagrams show the enrichment score (green line), which reflects the degree to which that particular gene set is overrepresented in the differentially expressed genes between II+ROP16I strain- and type II strain-infected Peyer's patches (ranked by their differential expression values, where 1 is the gene most highly induced by the II+ROP16I strain). The middle portion of the diagram shows where the members of the particular gene set (black bars) appear in the ranked gene list.

