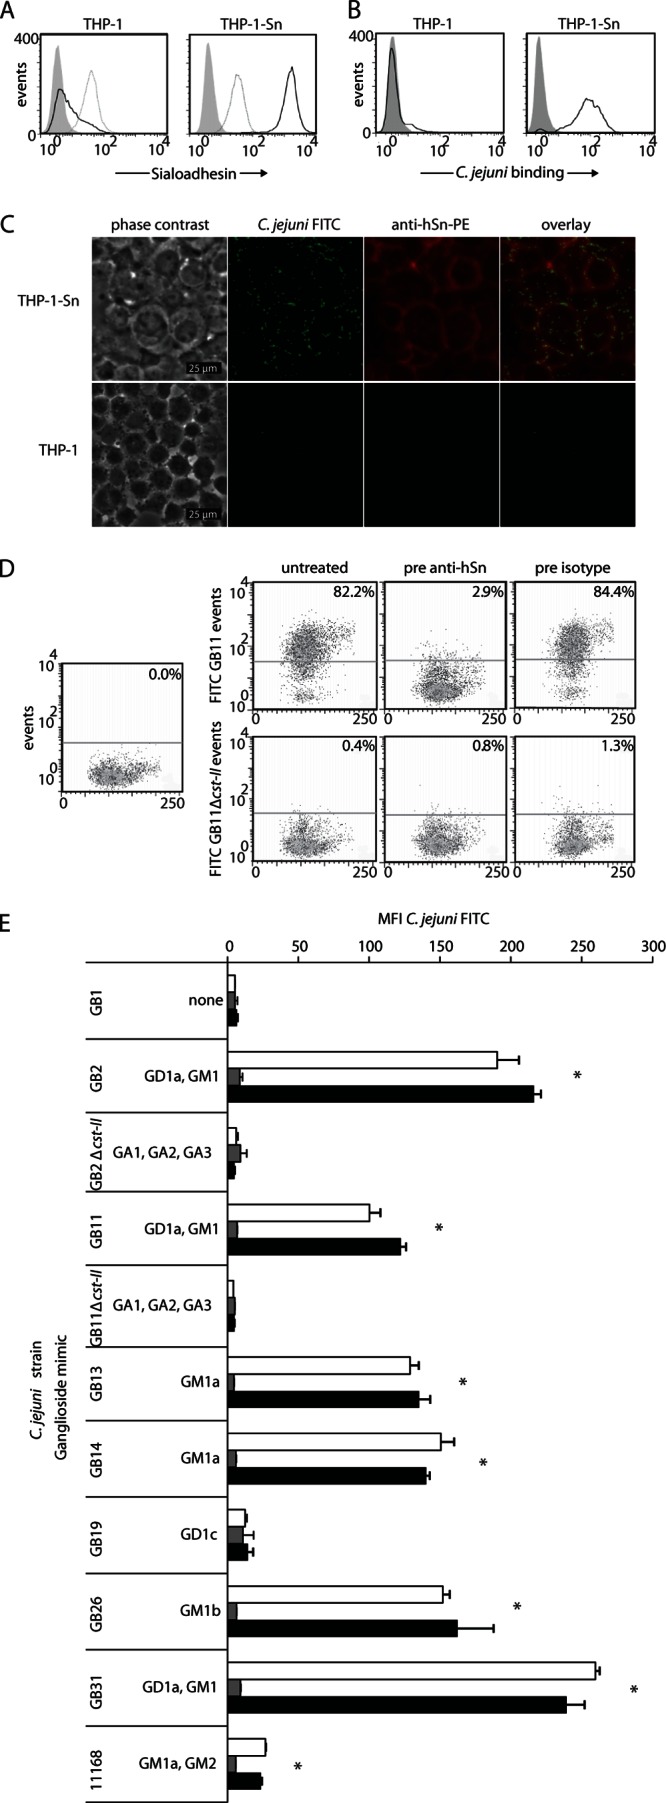
Fig 1.

C. jejuni interacts with human Sn expressed on THP-1-Sn cells in a sialic acid- and Sn-dependent manner. (A) Confirmation of Sn expression on THP-1-Sn cells. Flow-cytometric analysis of Sn expression on THP-1 and THP-1-Sn cells, using an anti-hSn-PE antibody or isotype control antibody. Events indicate the FL-2 signal within the live cell population of unstained cells (filled gray curves), isotype control-stained cells (dotted-line curves), and anti-hSn-PE-stained cells (solid-line curve). (B) Flow-cytometric analysis of the interaction of heat-inactivated FITC-labeled C. jejuni strain GB11 incubated with THP-1 or THP-1-Sn cells for 2 h. Events indicate the FL-1 signal within the living cell population in the absence (filled gray curves) or presence (solid-line curves) of FITC-labeled GB11. (C) Immunofluorescent staining of hSn on THP-1 and THP-1-Sn cells incubated with heat-inactivated FITC-labeled C. jejuni strain GB11 for 2 h, using an anti-hSn-PE antibody. C. jejuni is shown in green, hSn in red. (D) Flow-cytometric analysis of the interaction of FITC-labeled C. jejuni strains GB11 and GB11Δcst-II with THP-1-Sn cells in the presence or absence of hSn blocking using an anti-hSn antibody or isotype control antibody, respectively. The percentages of cells binding C. jejuni within the living cell populations are indicated. (E) Binding of a panel of FITC-labeled, heat-inactivated C. jejuni strains with known ganglioside-mimicking structures to THP-1-Sn cells. The cells were either untreated (white bars) or pretreated with an antibody against hSn (gray bars) or an isotype control antibody (black bars). Living cells were gated and used for analysis. Results represent the data from one experiment that was repeated at least two times, shown as means ± SD of triplicate measurements. *, P < 0.05 (by one-way ANOVA) for the comparison of untreated (white bars) and isotype control treatment (black bars) versus anti-hSn treatment (gray bars).
