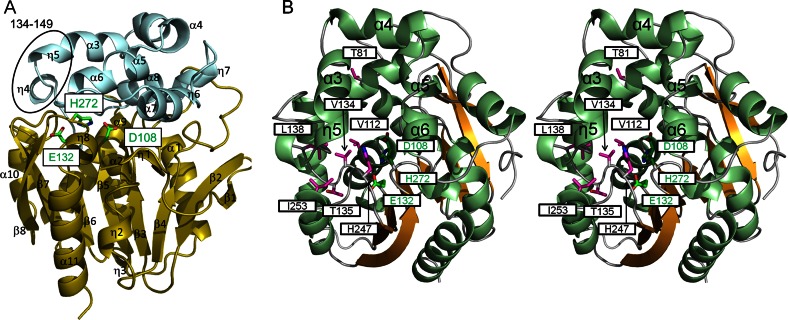
Fig 3.
Structure of wild-type LinBMI. (A) Ribbon diagram of wild-type LinBMI. The core domain (residues 2 to 132 and 214 to 295) and the cap domain (residues 133 to 213) are colored olive and light blue, respectively. The catalytic triad residues are shown as stick models. The most flexible region (residues 134 to 149) in LinBMI is circled in black. (B) Stereo view of wild-type LinBMI. The helices and strands are colored light green and orange, respectively. The catalytic triad residues and the residues which are different from the corresponding residues in LinBUT are shown as stick models and colored green and magenta, respectively.

