Fig 7.
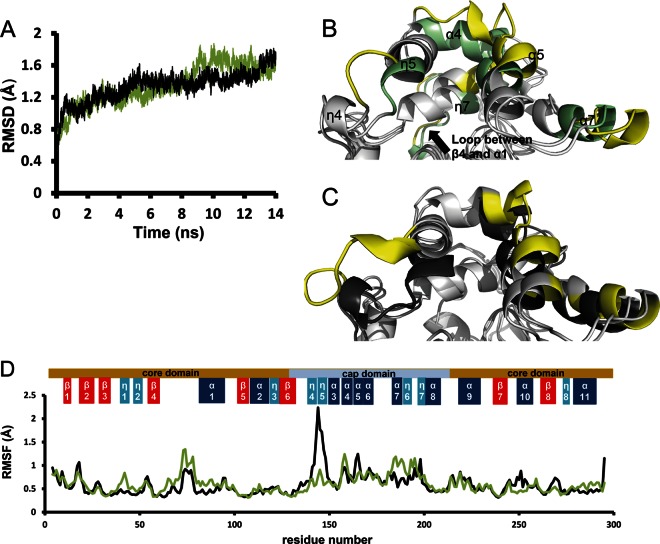
Molecular dynamics (MD) simulations of wild-type LinBMI and LinBUT. (A) Time course of Cα RMSDs from the initial structures of wild-type LinBMI (green) and LinBUT (black) during MD simulations. (B) Superposition of the crystal structure (gray and green) and the structure after the simulation (gray and yellow) of wild-type LinBMI. (C) Superposition of the crystal structure (gray and black) and the structure after the simulation (gray and yellow) of wild-type LinBUT. Green, black, and yellow in panels B and C indicate the most different regions observed between the crystal structures and the structures after the simulations (gray and yellow). (D) Cα RMSFs for LinBMI (green) and LinBUT (black) residues over the last 2-ns simulations.

