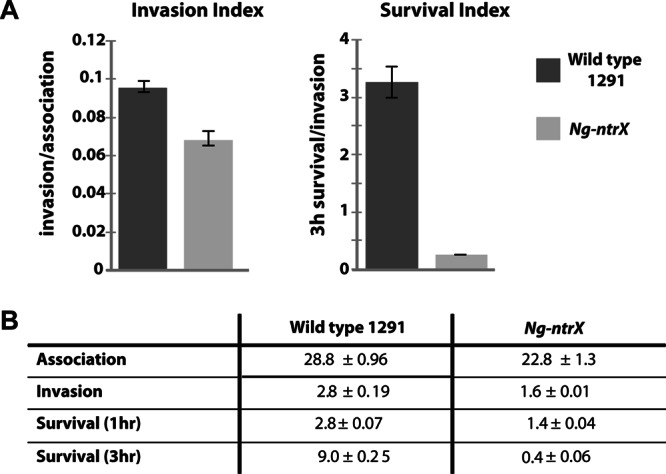
Fig 3.

(A) Pex cell survival assays of the 1291 wild-type strain and the Ng-ntrX mutant represented as an index of invasion (invasion/association) and survival (3-h survival/invasion). For the invasion index, P = 0.0016; for the survival index, P = 0.0001. Error bars are a measure of variance from the mean; P values for the invasion and survival indices were determined using Student's t test. (B) Data from pex cell association, invasion, and survival assays used to generate the data shown in panel A, shown as a percentage of the initial inoculum. All data are averages from three separate experiments. P values for association, invasion, and the 1- and 3-h survival rates for the 1291 wild-type strain versus the Ng-ntrX mutant are all ≤0.0001. Errors represent variance from the mean; P values were calculated using a Kruskal-Wallis ANOVA. Experiments were performed in triplicate on three separate occasions.
