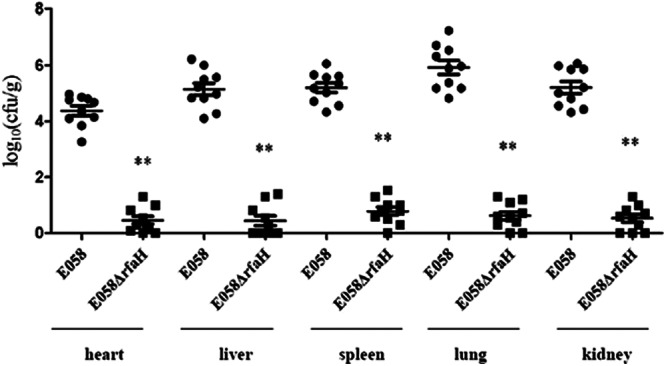
Fig 6.

In vivo competition assays. E058 (●) and mutant E058ΔrfaH (■) were inoculated simultaneously. The data are presented as log10 CFU · g of tissues−1. The horizontal bars indicate the mean log10 CFU · g−1. Each data point represents a sample from an individual chicken. Statistically significant differences in values between E058 and its mutant are indicated by asterisks (**, P < 0. 01). The error bars indicate standard deviations.
