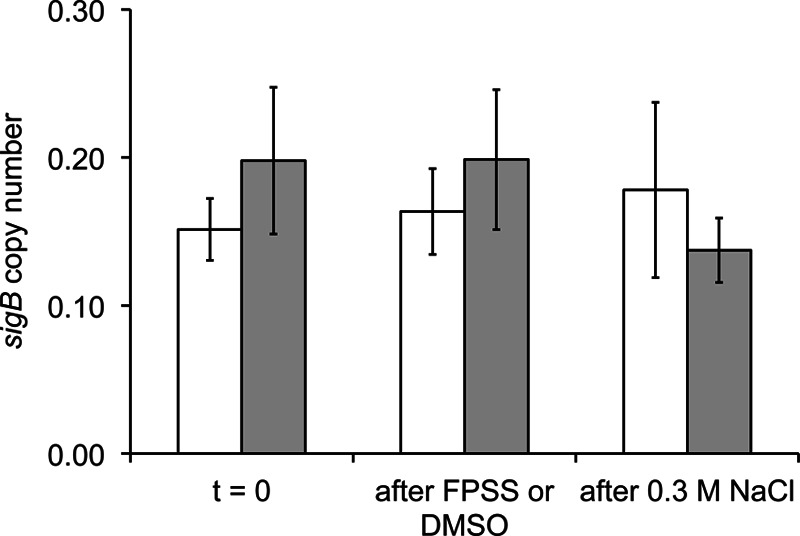
Fig 2.

sigB transcript copy numbers after addition of FPSS or DMSO. L. monocytogenes 10403S ΔsigB was grown in BHI at 37°C with shaking (225 rpm). At an OD600 of 0.4, 5 ml of culture was removed and was added to 5 ml RNAprotect (Qiagen) to stop transcription prior to RNA isolation (t = 0). FPSS (64 μM) or an equal volume of DMSO was added to the remaining cultures. After 15 min, another 5-ml aliquot was removed for RNA isolation (“after FPSS or DMSO”). Salt (0.3 M [final concentration] NaCl) was added to both cultures, and after 15 min, another 5 ml of culture was collected (“after 0.3 M NaCl”). Mean values for sigB transcript copy numbers (in arbitrary units) from a DMSO-treated culture (open bars) and an FPSS-treated culture (shaded bars), calculated from three biological replicates, are shown with standard deviations. sigB transcript copy numbers were normalized to rpoB transcript copy numbers in order to calculate relative transcript levels.
