Fig 8.
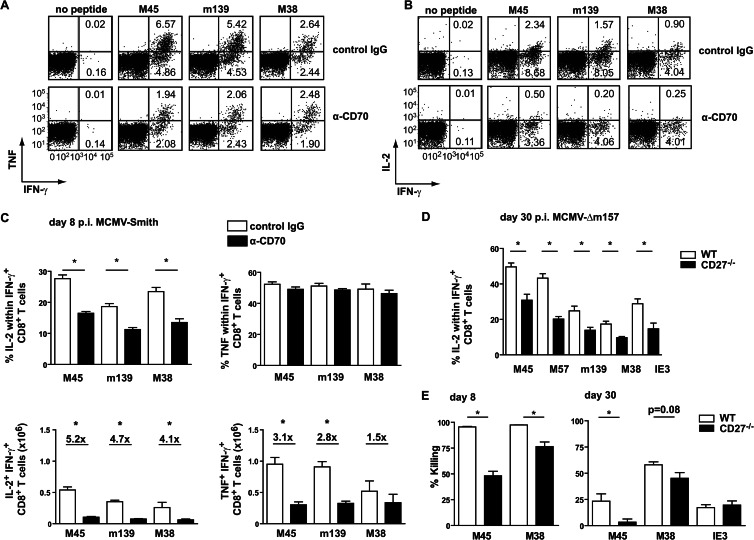
CD27-CD70 costimulation influences autocrine IL-2 production of both noninflationary and inflationary CD8+ T cell populations. (A to C) Mice were infected with 1 × 10⁴ PFU MCMV-Smith, and a blocking anti-CD70 or control antibody was administered. At 8 days postinfection, the MCMV-specific CD8+ T cell responses in the spleen were analyzed by intracellular cytokine staining upon peptide restimulation. (A) Representative flow cytometry plots showing intracellular TNF and IFN-γ production by splenic CD8+ T cells after restimulation with the indicated class I peptides at day 8 postinfection. Percentages of TNF+ IFN-γ+ and IFN-γ+ cells are indicated. (B) Representative flow cytometry plots showing intracellular IL-2 and IFN-γ production by splenic CD8+ T cells after restimulation with the indicated class I peptides at day 8 postinfection. Percentages of IL-2+ IFN-γ+ and IFN-γ+ cells are indicated. (C) Percentages of IL-2- or TNF-producing cells within the IFN-γ+ CD8+ T cells and total numbers of IFN-γ+ IL-2+ or IFN-γ+ TNF+ CD8+ T cells per spleen. Fold differences are indicated. Pooled data from two independent experiments are shown. (D) Wild-type and CD27−/− mice were infected with 1 × 10⁴ PFU MCMV-Δm157, and at day 30 postinfection, the percentage of IFN-γ+ CD8+ T cells coproducing IL-2 in the spleen was determined by intracellular cytokine staining. Pooled data from two independent experiments are shown. (E) WT and CD27−/− mice received differentially labeled target cells, at days 8 and 30 postinfection, that were unloaded or loaded with M45, M38, or IE3. The graphs show the percentages of target cells that were killed after 3 h (day 8) or 5 h (day 30). For all experiments, bar graphs show means and SEM. Statistical significance was determined with the Student t test (*, P < 0.05; n = 4 to 8).

