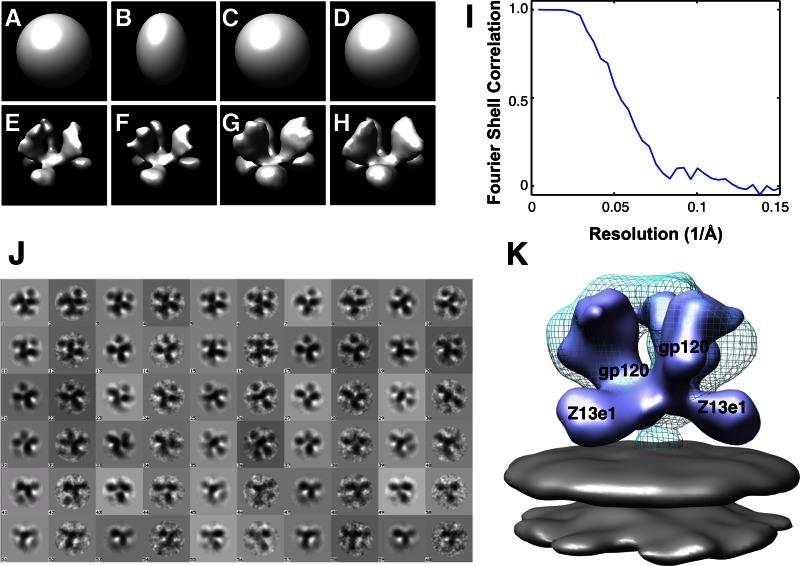
Fig 2.
Refinement of the structure of the Z13e1-Env complex and comparison with the 3D structure of native Env. (A to H) Starting with unstructured Gaussian blobs as initial models, progressive steps in refinement with CTF-corrected phase-flipped images were carried out in the environment of the image-processing program EMAN (20). Starting models are shown in panels A to D, and the corresponding final models are shown in the same sequence in panels E to H. Gaussian blobs with different elongations in the perpendicular axis (panels A and B, with 1 and 2 times the elongation in the in-plane axes, respectively) were used as starting models in order to study the effect of initial model bias. For these experiments, the particle stack was low-pass filtered to 20 Å and binned by a factor of 2 to speed up the computations. Despite the difference in the shape of the starting models, the two instances produced similar reconstructions at low resolution, indicating robustness of the 3D refinement procedure. The binned particle stack was then split into two stacks: one containing the odd- and the other the even-number particles (3,525 images in each). Each stack was independently subjected to 3D refinement using the same Gaussian blob as the initial model and the same refinement parameters. These two independent refinements (panels C and D) also converged to the same 3D model, providing further proof of the validity of the 3D reconstruction. The full unbinned particle stack was then used to further refine the reconstruction using EMAN1's refine program with the following options: “mask = 70 pad = 256 hard = 25 classkeep = 0.8 classiter = 8 sym = C3 phasecls refine.” The angular spacing for the rotational search was initially set to 8 degrees and then lowered to 5.7 degrees in the final refinement stages. The particle stack was low pass filtered to 20 Å during the coarser angular search stage and to 12 Å during the finer search. Refinement was stopped once the assignments of class memberships and angular orientations did not change significantly (after a total of 136 iterations). (I) Fourier shell correlation (FSC) plot obtained using all particles, computed using EMAN1's program eotest with the options “hard = 25 sym = c3 mask = 70 pad = 256 classkeep = 0.8 classiter = 8 fscmp,” giving an estimated resolution of 18.5 Å as measured by the 0.5-cutoff FSC criteria. (J) Alternating gallery of reprojections of the refined 3D model (odd columns) and corresponding class averages obtained from the refinement procedure (even columns) is shown. (K) Superposition of the map of the Z13e1-Env complex (solid isosurface), produced using the software program UCSF Chimera (21), with the density map for native HIV-1 BaL trimeric Env (Electron Microscopy Data Bank identifier 5019 [EMDB ID 5019]) (cyan wire-mesh) (5). The Z13e1 Fab density is oriented roughly perpendicular to the trimeric 3-fold axis and is located above the plane of the viral membrane (gray).

