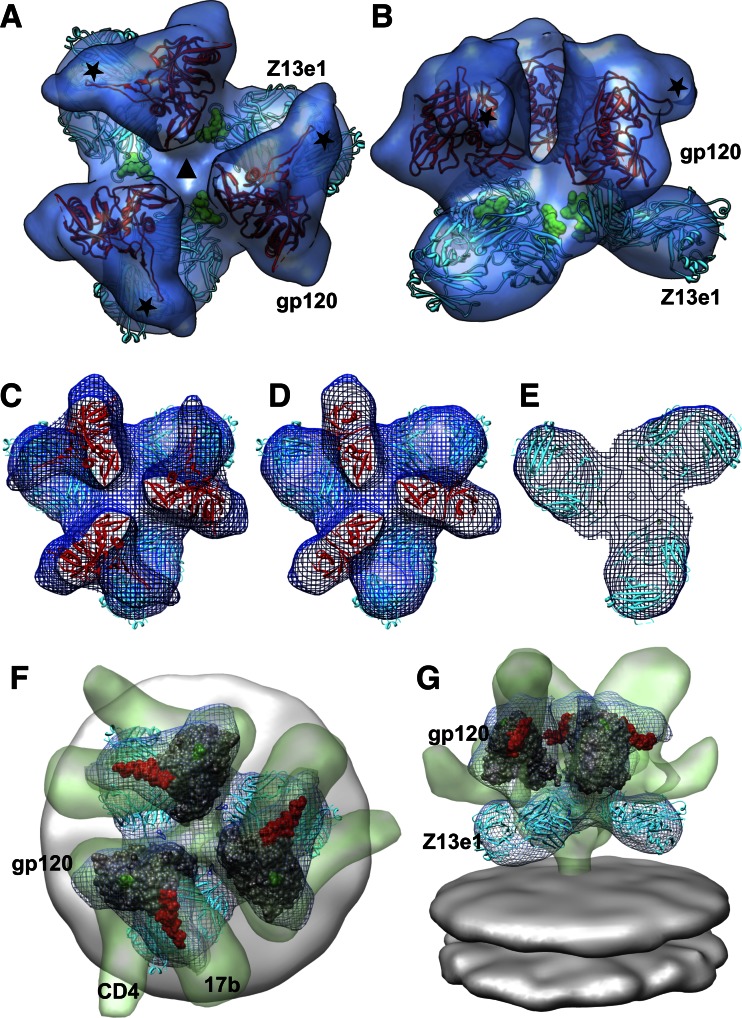
Fig 3.
Molecular model for the Z13e1-Env complex. Top (A) or side (B) view of the density map (transparent isosurface), shown with docked coordinates for gp120 (PDB ID 1GC1; in red) and Fab Z13e1 (PDB ID 3FN0; in cyan). The MPER peptide epitope bound by Z13e1 is shown as a space-filling model (in green) and is located near the base of trimeric gp140. The asterisks mark the expected locations of the density for the V1/V2 loop region, which were truncated in the gp120 construct crystallized to obtain the gp120 structure reported in the 1GC1 coordinates. The gp120 and Z13e1 structures were docked into the map using automated fitting procedures implemented in the UCSF Chimera software package (21). (C to E) Selected slices through the reconstruction, with the map shown in wire mesh. (F and G) Comparison of quaternary state of trimeric gp120 in the Z13e1-bound state with that of sCD4/17b-bound Env complex (EMDB ID 5020), with both maps fit to the same coordinates for the gp120 trimer (PDB ID 3DNO). Top (F) or front (G) view is shown. The map of the Env/sCD4/17b complex is in transparent green, with CD4 and 17b Fab density protrusions labeled, and the Z13el map is in blue mesh; the gp120 core is shown in dark gray, with the stumps of the truncated V1/V2 and V3 loops shown in red and green, respectively. The Z13e1 Fab coordinates are cyan.

