
Fig 8.
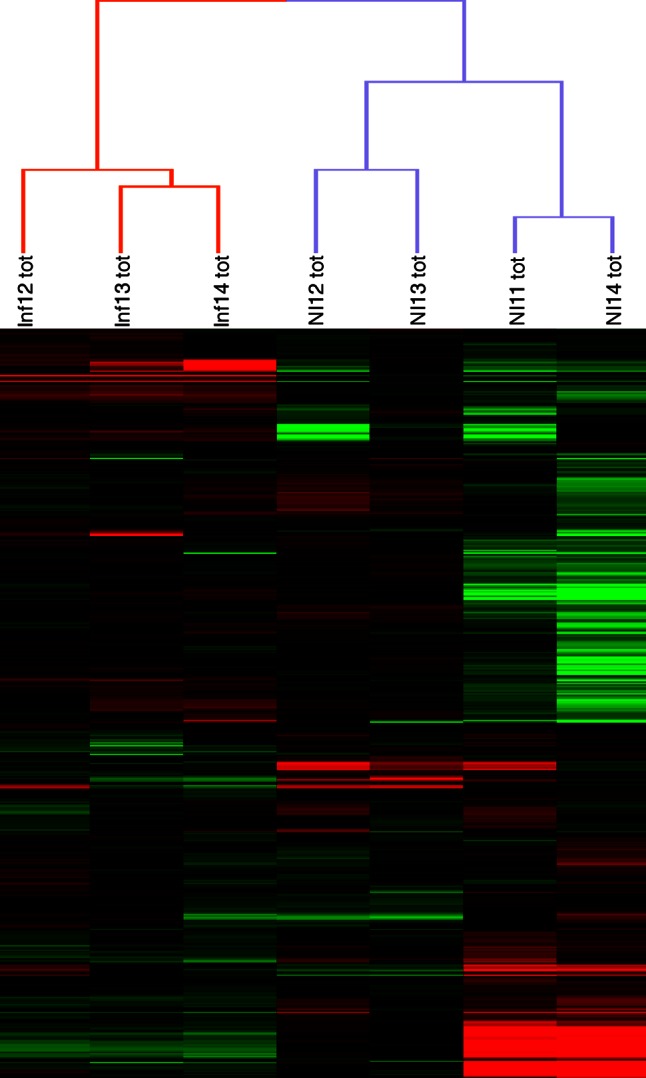
Hierarchical clustering of the infected and noninfected samples analyzed on miRNA microarrays. On the heat map, the rows represent the miRNA quantitation data (log transformed and median centered), and the columns represent the RNA samples.
Official websites use .gov
A
.gov website belongs to an official
government organization in the United States.
Secure .gov websites use HTTPS
A lock (
) or https:// means you've safely
connected to the .gov website. Share sensitive
information only on official, secure websites.
Hierarchical clustering of the infected and noninfected samples analyzed on miRNA microarrays. On the heat map, the rows represent the miRNA quantitation data (log transformed and median centered), and the columns represent the RNA samples.