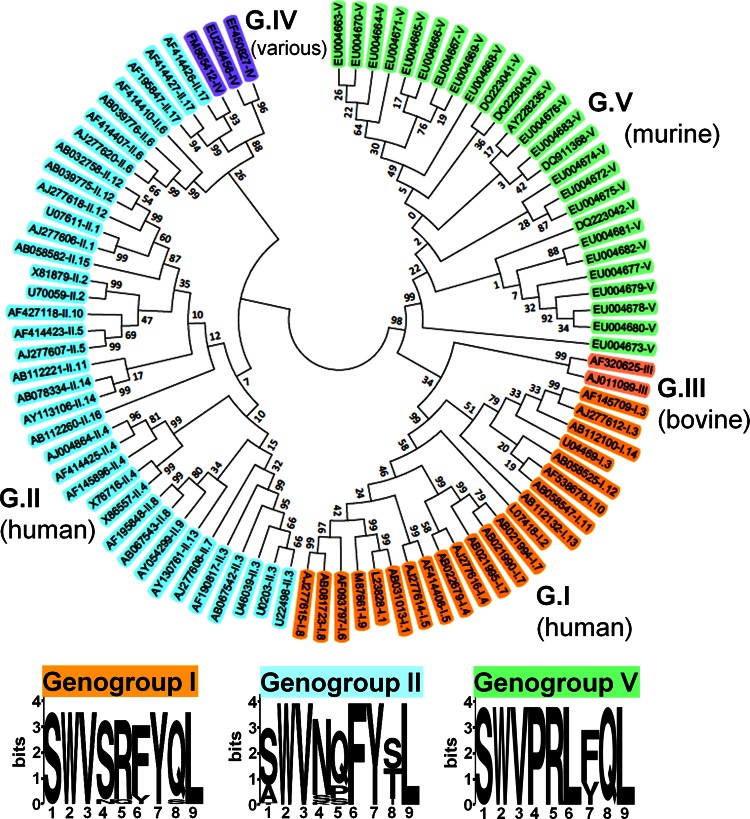
Fig 4.
Epitope P1519 is highly conserved among all Norovirus genogroups. We constructed a phylogenetic tree containing members of all genogroups and genotypes (GenBank accession numbers are indicated). The evolutionary history was inferred using the neighbor-joining method (54). The optimal tree with the sum of branch length of 5.06925373 is shown. The tree is drawn to scale, with branch lengths in the same units as those of the evolutionary distances used to infer the phylogenetic tree. The evolutionary distances were computed using the Kimura 2-parameter method (55) and are in units of the number of base substitutions per site. The analysis involved 90 nucleotide sequences. All positions containing gaps and missing data were eliminated. There were a total of 228 positions in the final data set. Evolutionary analyses were conducted in MEGA5 (56). A sequence homologous to the P1519 epitope identified in this study was present in the C terminus of capsids from all sequences analyzed (see Table 1 for the precise epitope motif of each clone shown here). The 9-amino-acid consensus sequences for genogroups I, II, and V are shown. In the logos, the height of each column of letters is equal to the information content (in bits) at the given position in the epitope. The relative height of each letter within each column is proportional to the frequency of the corresponding amino acid at that position (generated using WebLogo, http://weblogo.berkeley.edu/logo.cgi) (58).

