Fig 5.
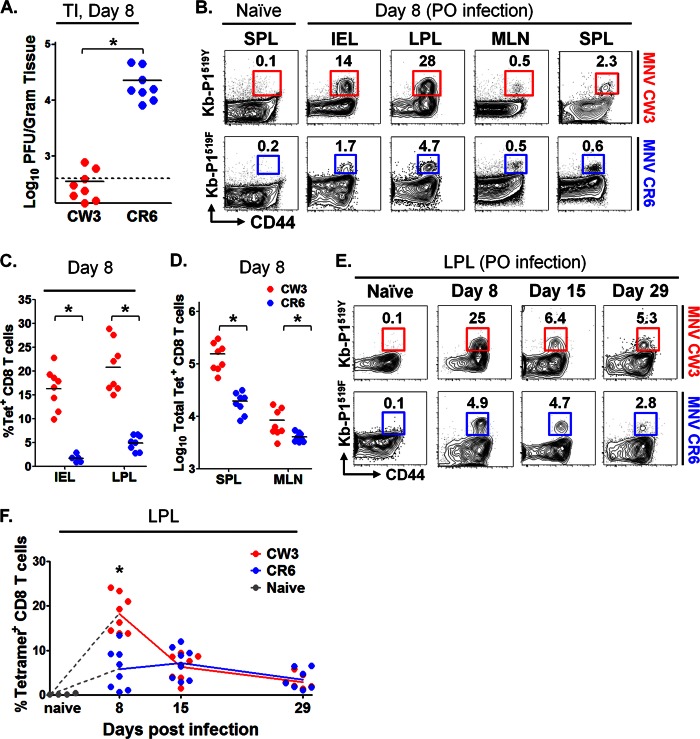
Robust epitope P1519-specific T cell responses following MNV infection. Mice were infected p.o. with 1.5 × 10⁶ PFU of MNV-CW3 or MNV-CR6. (A) Viral load in the terminal ileum (TI) was assessed on day 8 p.i. with MNV-CW3 or MNV-CR6. Dotted line indicates limit of detection. (B) Epitope-specific CD8 T cells in the indicated tissues were detected by tetramer staining on day 8 p.i. The data are representative of 8 mice per group. (C) Fractions of epitope-specific CD8 T cells in the IEL and LPL. The average absolute numbers of Tet+ IEL on day 8 were 1 × 10⁵ for MNV-CW3 and 1.5 × 10⁴ for MNV-CR6. (D) Total numbers of Tet+ CD8 T cells in spleen and MLN at day 8 p.i. In panels A, C, and D, horizontal lines show the means. (E) The epitope-specific CD8 T cell response in the LP was tracked for 29 days p.i. (F) Graph shows longitudinal summary data for the percentages of CD8 T cells staining with the respective MNV tetramer for MNV-CW3 versus MNV-CR6 infection. Note that MNV-CW3 and MNV-CR6 differ by a single amino acid in epitope P1519, and therefore, tetramers matching the appropriate strain were used in these experiments. In the experiment whose results are shown in panel A, naive cells were from the spleen; in the experiment whose results are shown in panel E, naive cells were from the LP. Naive cells from MLN and IEL showed similar backgrounds of tetramer staining (data not shown). *, differences between groups by the unpaired t test were statistically significant (P < 0.05).

