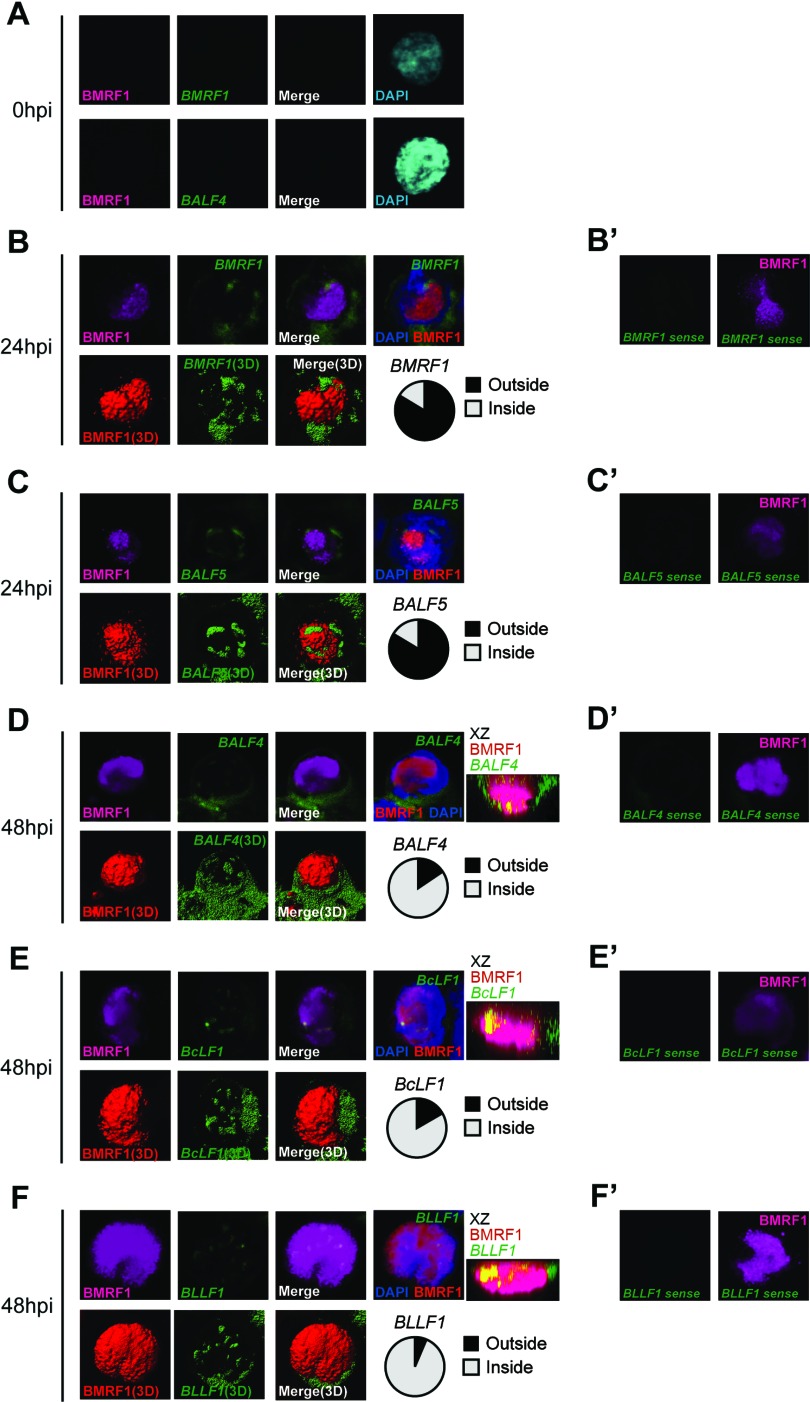
Fig 3.
Alteration of viral gene transcription foci at early and late stages of EBV lytic replication. Lytic replication-induced tet-BZLF1/B95-8 cells were hybridized with DIG-labeled RNA FISH probes and then exposed to anti-BMRF1 antibodies (magenta), anti-DIG antibodies (green), and DAPI (blue). The data are presented as 3D reconstruction images (lower panels; merged images are at the right) and corresponding 2D images (upper panels). The 2D images show brightest-point projections of 60 images collected at 0.33-μm steps on the z axis. (A) Lytic replication-induced tet-BZLF1/B95-8 cells were harvested at 0 h postinduction and hybridized with antisense mRNA probes for BMRF1 (upper panels) and BALF4 (lower panels), followed by exposure to anti-BMRF1 monoclonal antibodies (magenta). (B and C) Lytic replication-induced tet-BZLF1/B95-8 cells were harvested at 24 h postinduction and hybridized with antisense mRNA probes for BMRF1 (B) and BALF5 (C), followed by exposure to anti-BMRF1 monoclonal antibodies (magenta). More than 30 cells were counted, and the ratio of the cells in which FISH signals were located outside the BMRF1 core to total BMRF1-positive cells was determined (circle chart, black). (D to F) Lytic replication-induced tet-BZLF1/B95-8 cells were harvested at 48 h postinduction and hybridized with antisense mRNA probes for BALF4 (D), BcLF1 (E), and BLLF1 (F), followed by exposure to anti-BMRF1 monoclonal antibodies (magenta). x-z 2D merged images, which show brightest-point sections in the y axis, are also shown. More than 30 cells were counted, and the ratio of the cells in which FISH signals were located inside the BMRF1 core to total BMRF1-positive cells was determined (circle chart, gray). (B′ to F′) As negative controls, cells were hybridized with a sense RNA probe for BMRF1 (B′), BALF5 (C′), BALF4 (D′), BcLF1 (E′), and BLLF1 (F′), followed by exposure to anti-BMRF1 monoclonal antibodies (magenta).

