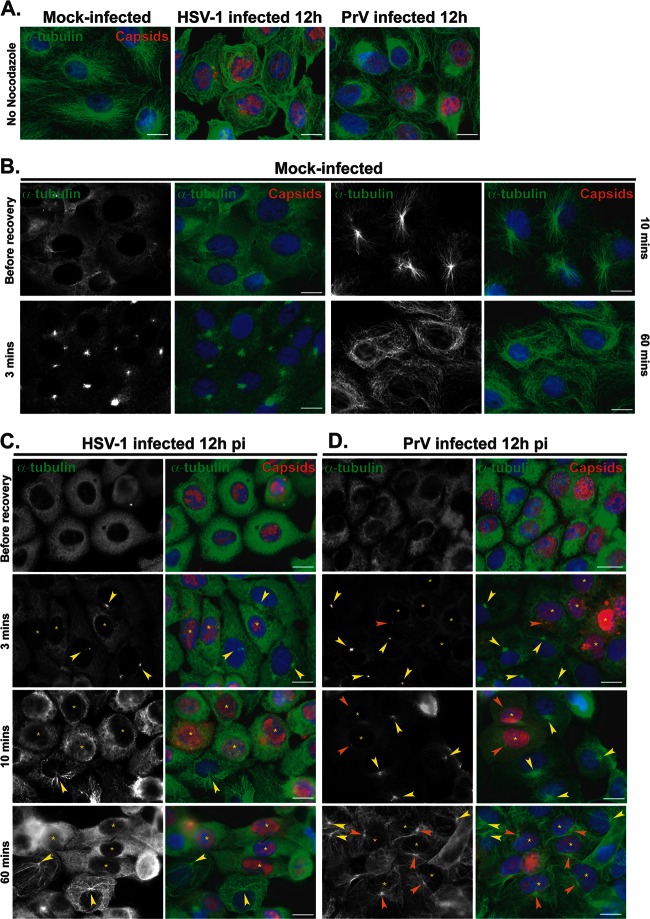
Fig 6.
Recovery of nocodazole-disrupted MTs in Vero cells infected with HSV-1 or PrV. (A) Comparison of MT networks in untreated Vero cells that were mock infected or infected with HSV-1 or PrV for 12 h. (B to D) Nocodazole recovery experiments. Vero cells were mock infected (B) or infected with HSV-1 (C) or PrV (D) for 12 h before being treated with 10 μM nocodazole. One hour later, the drug was washed out and cells were fixed after the indicated times. MTs were visualized using a mouse antibody directed against alpha-tubulin (green). HSV-1-infected cells were visualized using the PTNC rabbit antibody and PrV-infected cells using the 1702 rabbit antibody (red). Arrowheads in panels C and D indicate centers of MT growth in infected cells (orange) or uninfected cells (yellow). Asterisks indicate infected cells in panels also containing uninfected cells. Note that MT growth is absent (C) or limited (D) in infected cells compared to uninfected cells. Bars, 20 μm.

