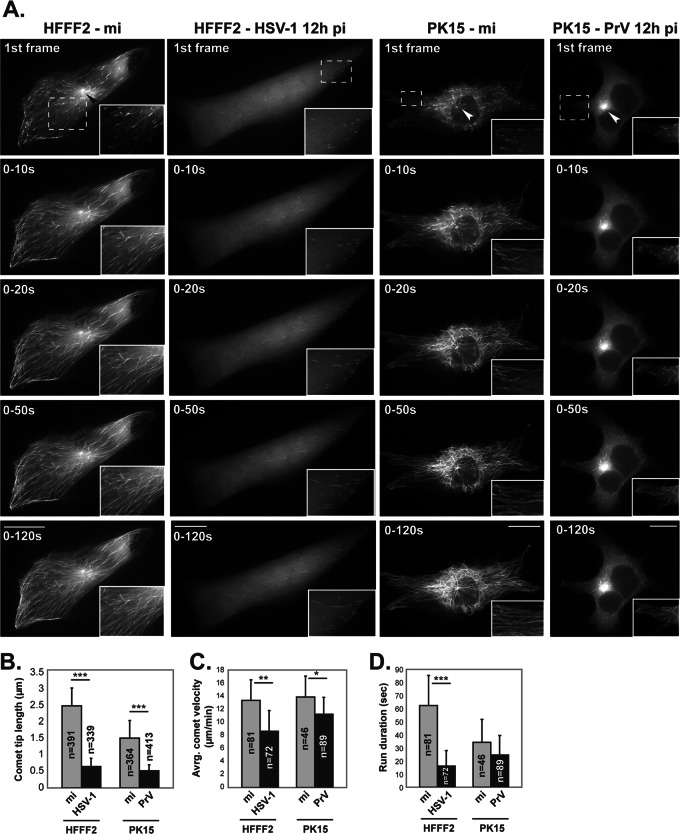
Fig 9.
MT growth in living HFFF2 and PK15 cells that were mock infected or infected with HSV-1 or PrV. HFFF2 and PK15 cells were transfected with a plasmid encoding GFP-EB3, a protein that localizes at plus-end tips of MTs. At 6 h later, HFFF2 cells were mock infected (mi) or infected with vUL35RFP1D1 (an HSV-1 virus in which the capsid protein VP26 is fused to the mRFP) and PK15 cells were infected with wild-type PrV. After a further 12 h, GFP-EB3 localization was recorded by live-cell microscopy at a rate of one frame every 2 s. Infected HFFF2 cells were identified by mRFP fluorescence (not shown). Infection of PK15 cells by PrV was subsequently checked by immunostaining for capsids (not shown). (A) Individual panels show cumulative projections of frames obtained over the indicated periods after the start of recording. Arrowheads show MT nucleating centers in the first frame images. An area from each cell image (dashed boxes) is enlarged. To observe MT growth, see Movies S1 and S2 (mock-infected and HSV-1-infected HFFF2 cells, respectively) and Movies S3 and S4 (mock-infected and PrV-infected PK15 cells, respectively) in the supplemental material. Bars, 20 μm. Movies were taken at a rate of 1 frame every 2 s for 120 s and are shown at a rate of 10 frames/s. (B) The length of 730 EB3 comets was measured in single time frames from movies of nine mock-infected (mi) and 10 HSV-1-infected HFFF2 cells. The length of 777 EB3 comets was measured in single time frames from movies of four uninfected and eight PrV-infected PK15 cells. (C and D) A total of 153 (HFFF2) and 135 (PK15) comets were tracked, and their velocity was measured (C) as well as the number of consecutive frames where they could be tracked (run duration) (D). *, P < 0.05; **, P < 0.01; ***, P < 0.001.

