
Figure 2. Deconstruction and analysis of CDR-H3.
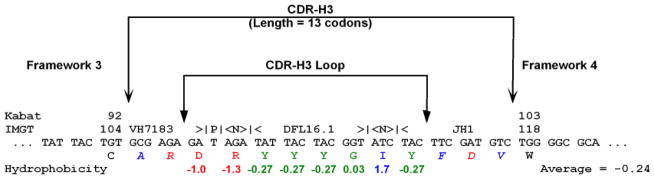
In this hypothetical sequence, the location of CDR-H3, the CDR-H3 loop, and boundaries of FRs 3 and 4 are shown. Kabat and IMGT (5,76) number designations for the TGT codon which marks the terminus of framework 3 and the TGG which marks the beginning of framework 4 are identified. Here the CDR-3 loop has been evaluated for the distribution of individual amino acids and average Kyte-Doolittle hydrophobicity (77,78). Amino acids at the extreme (arginine and isoleucine) have been included to demonstrate the range of the hydrophobicity index. The normalized average hydrophobicity of this CDR-H3 loop is −0.24. This CDR-H3 has also been evaluated for VH, DH, and JH usage, P junctions, N addition, and the length of CDR-H3 in codons. A single palindromic (P) nucleotide flanks the VH sequence. DH DFL16.1 sequence is flanked by three nucleotides of N addition on each side. To facilitate analysis, we have color-coded our data in this and other figures in this application to report relative hydrophobicity. Blue reflects hydrophobicity, green represents neutrality with or without hydrophilicity, and red is used for charge.