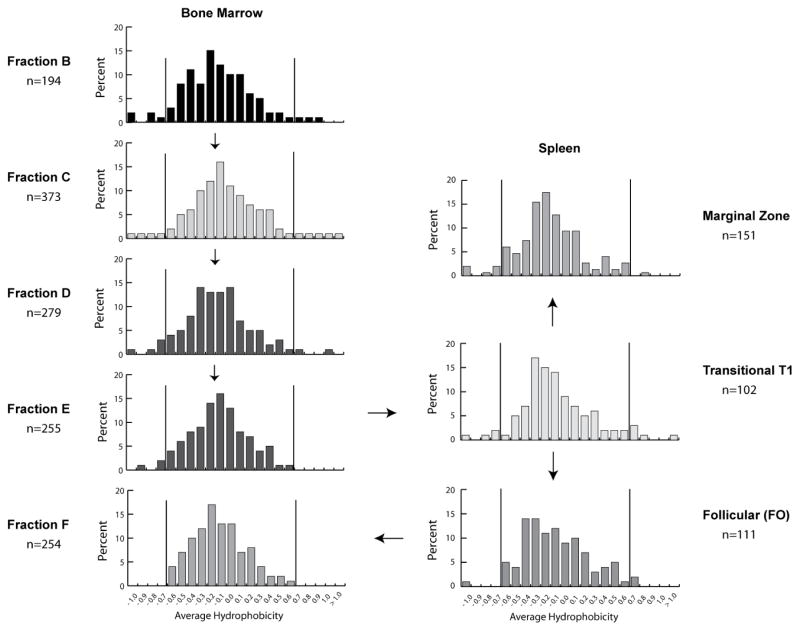
Figure 3.
Distribution of CDR-H3 charge in VDJCμ transcripts of WT BALB/c mice isolated from phenotypically defined bone marrow and spleen B cell populations as assessed 30 by reference to a normalized Kyte-Doolittle scale (79,80). Prevalence is reported as the percent of the sequenced population of unique, in-frame, open transcripts from each B lineage subset. To facilitate visualization of the change in variance of the distribution, the vertical lines mark the apparent normal boundaries beyond which it appears to be difficult to transition into fraction F.

