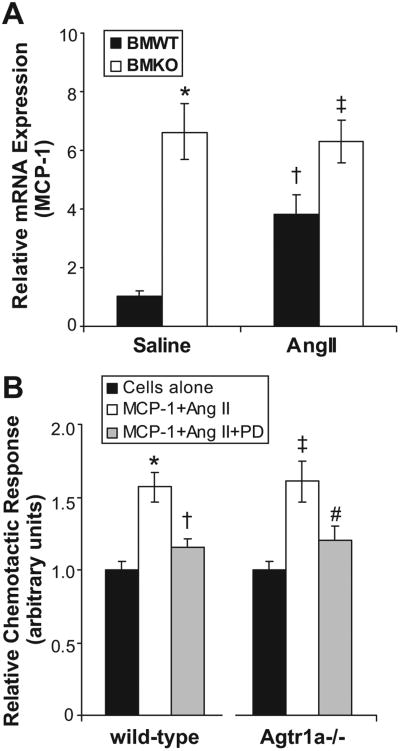
Figure 4.
Determinants of macrophage migration in the experimental groups. A, Renal MCP-1 expression measured by realtime PCR in the experimental groups after saline or Ang II infusion. *P=0.05 vs BMWT-saline. †P=0.02 vs BMWT-saline. ‡P=0.02 vs BMWT-Ang. B, Freshly isolated peritoneal WT or Agtr1a−/− macrophages were cultured in the upper chamber of a chemotaxis well with vehicle (black) or MCP-1 plus Ang II added to the lower chamber in the absence (white) or presence (gray) of AT2 receptor antagonist PD123319. MCP-1 with Ang II induced significant chemotaxis that was nearly abrogated by PD123319 compound in both groups. N=6 per group. *P=0.001 vs WT cells alone. †P<0.004 vs WT MCP-1/Ang II. ‡P<0.002 vs Agtr1a−/− cells alone. P value not significant vs WT MCP-1/Ang II. #P=0.04 vs Agtr1a−/− MCP-1/Ang II.

