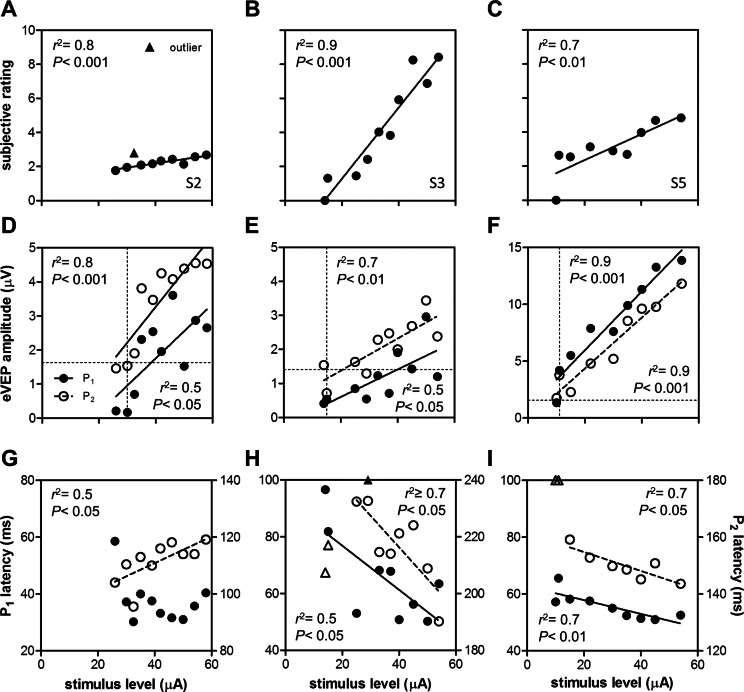
Figure 3. .
Effects of stimulus level on subjective rating (A–C), eVEP amplitude (D–F), and eVEP latency (G–I). Data were fitted by linear regression. Correlation coefficient (r2), and P values based on F-tests (H0: slope = 0) are indicated (insets). If the fitted function was not significantly different from the no-effect level, no line was drawn ([G], P1 data). eVEP data are shown for P1 (solid symbols) and P2 (open symbols). Outliers are indicated with triangles (A, H, I). When outliers were outside the y-axis limits, they are drawn at the highest level available (H, I). eVEP threshold amplitudes (D–F) were determined by calculating the x-intercept of the fitted function with the threshold amplitude y = 4·SD (horizontal dashed line, see Materials and Methods). These P1 and P2 threshold stimulus levels were compared with the subjective threshold (vertical dashed line).

