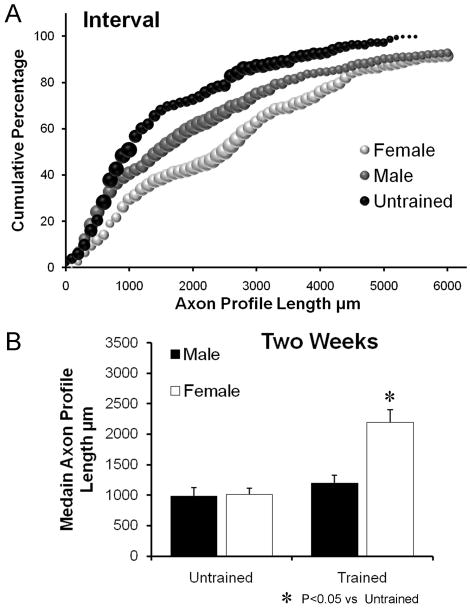
Figure 3.
A. Distributions of axon profile lengths measured in grafts two weeks following transection and repair of nerves of interval trained male and female mice and untrained mice of both sexes are shown as cumulative frequency histograms. Each data point in these graphs represents the average of the percentage of axon profiles that are at least as long as the corresponding axon profile length in that group (N=4 for each group). The size of each symbol is proportional to the standard error of the mean (SEM) of that data point. B. Average median (±SEM) lengths of regenerating axons in male and female Untrained and interval treadmill Trained mice, two weeks after nerve injury.

