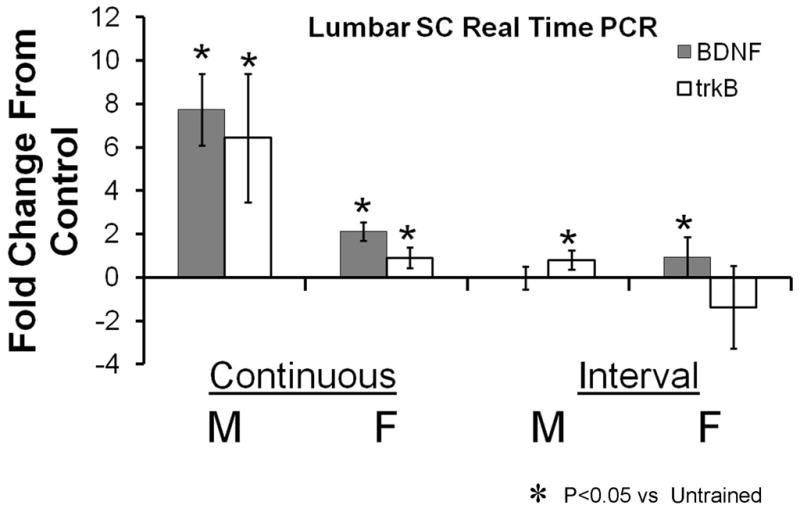
Figure 8.

Results of real time PCR analysis for BDNF and trkB expression in the lumbar spinal cord of treadmill trained mice are shown. All data are expressed as mean fold change from the expression found in a group of untrained matched controls. Each bar represents the mean (± 95% confidence intervals) of four samples. The axis line at y=0 represents the level associated with no change. Continuous trained and Interval trained groups are shown separately.
