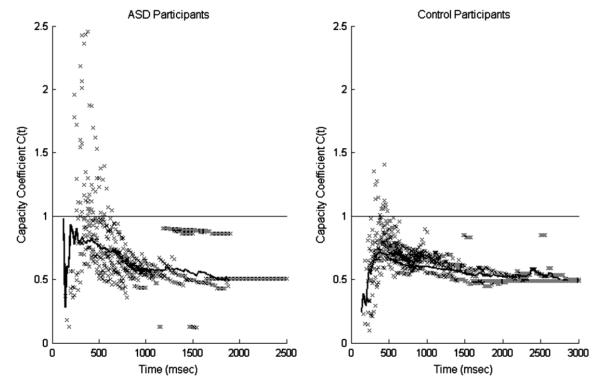
Fig. 6.
Capacity coefficient values at all times for all participants (scatter points) plotted together with the C(t) values for pooled data (solid line) for the ASD and control groups. The straight line at C(t) = 1 is the reference level of unlimited capacity processing, as predicted by the UCIP model. C(t) < 1 indicates limited capacity processing, while C(t) > 1 indicates super-capacity. Note that the pooled data line represents the distribution of all participants’ amalgamated data, not the average of the distributions from each participant.

