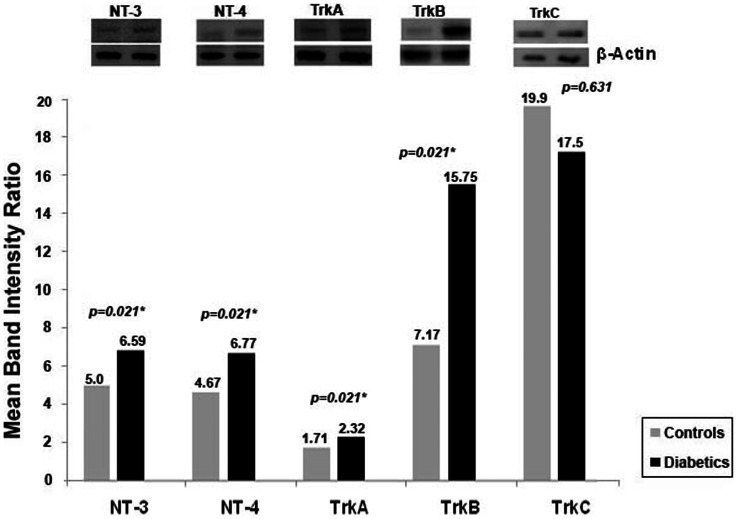
Figure 6. Comparison of mean band intensity ratios for neurotrophin-3 (NT-3), neurotrophin-4 (NT-4), TrkA, TrkB and TrkC in the retinas of diabetic and control rats.
Each Western blot experiment was repeated 3 times with fresh samples. *The difference between the two means was statistically significant at 5% level.

